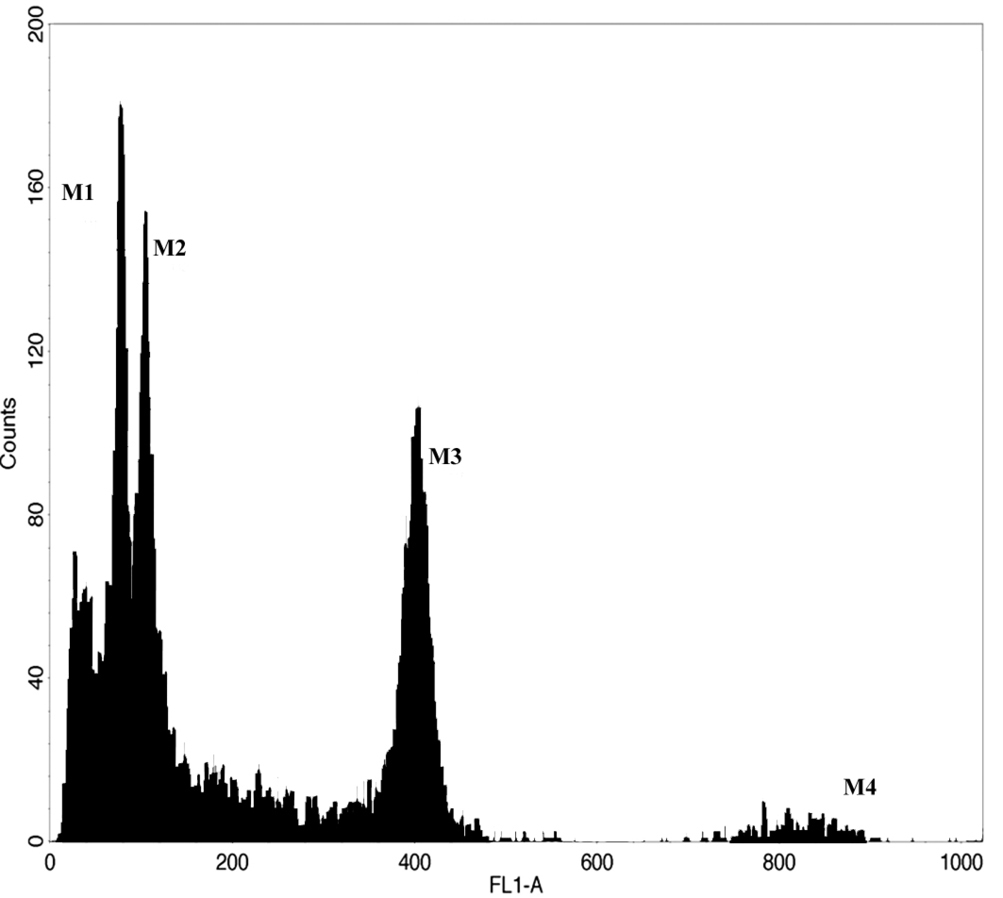
Flow Cytometry DNA content histogram. Flow cytometry analysis of DNA fluorescence peaks (FL1A) from G0/G1 (2C) PI stained leaf nuclei from cultivated cardoon (M1), globe artichoke (M2) and P. sativum (pea) (M3). Pea was used as an internal standard and the peak was set at channel 400; M4 shows pea G2 nuclei (4C).


  Part of: Giorgi D, Pandozy G, Farina A, Grosso V, Lucretti S, Gennaro A, Crinò P, Saccardo F (2016) First detailed karyo-morphological analysis and molecular cytological study of leafy cardoon and globe artichoke, two multi-use Asteraceae crops. Comparative Cytogenetics 10(3): 447-463. https://doi.org/10.3897/CompCytogen.v10i3.9469