|
||
|
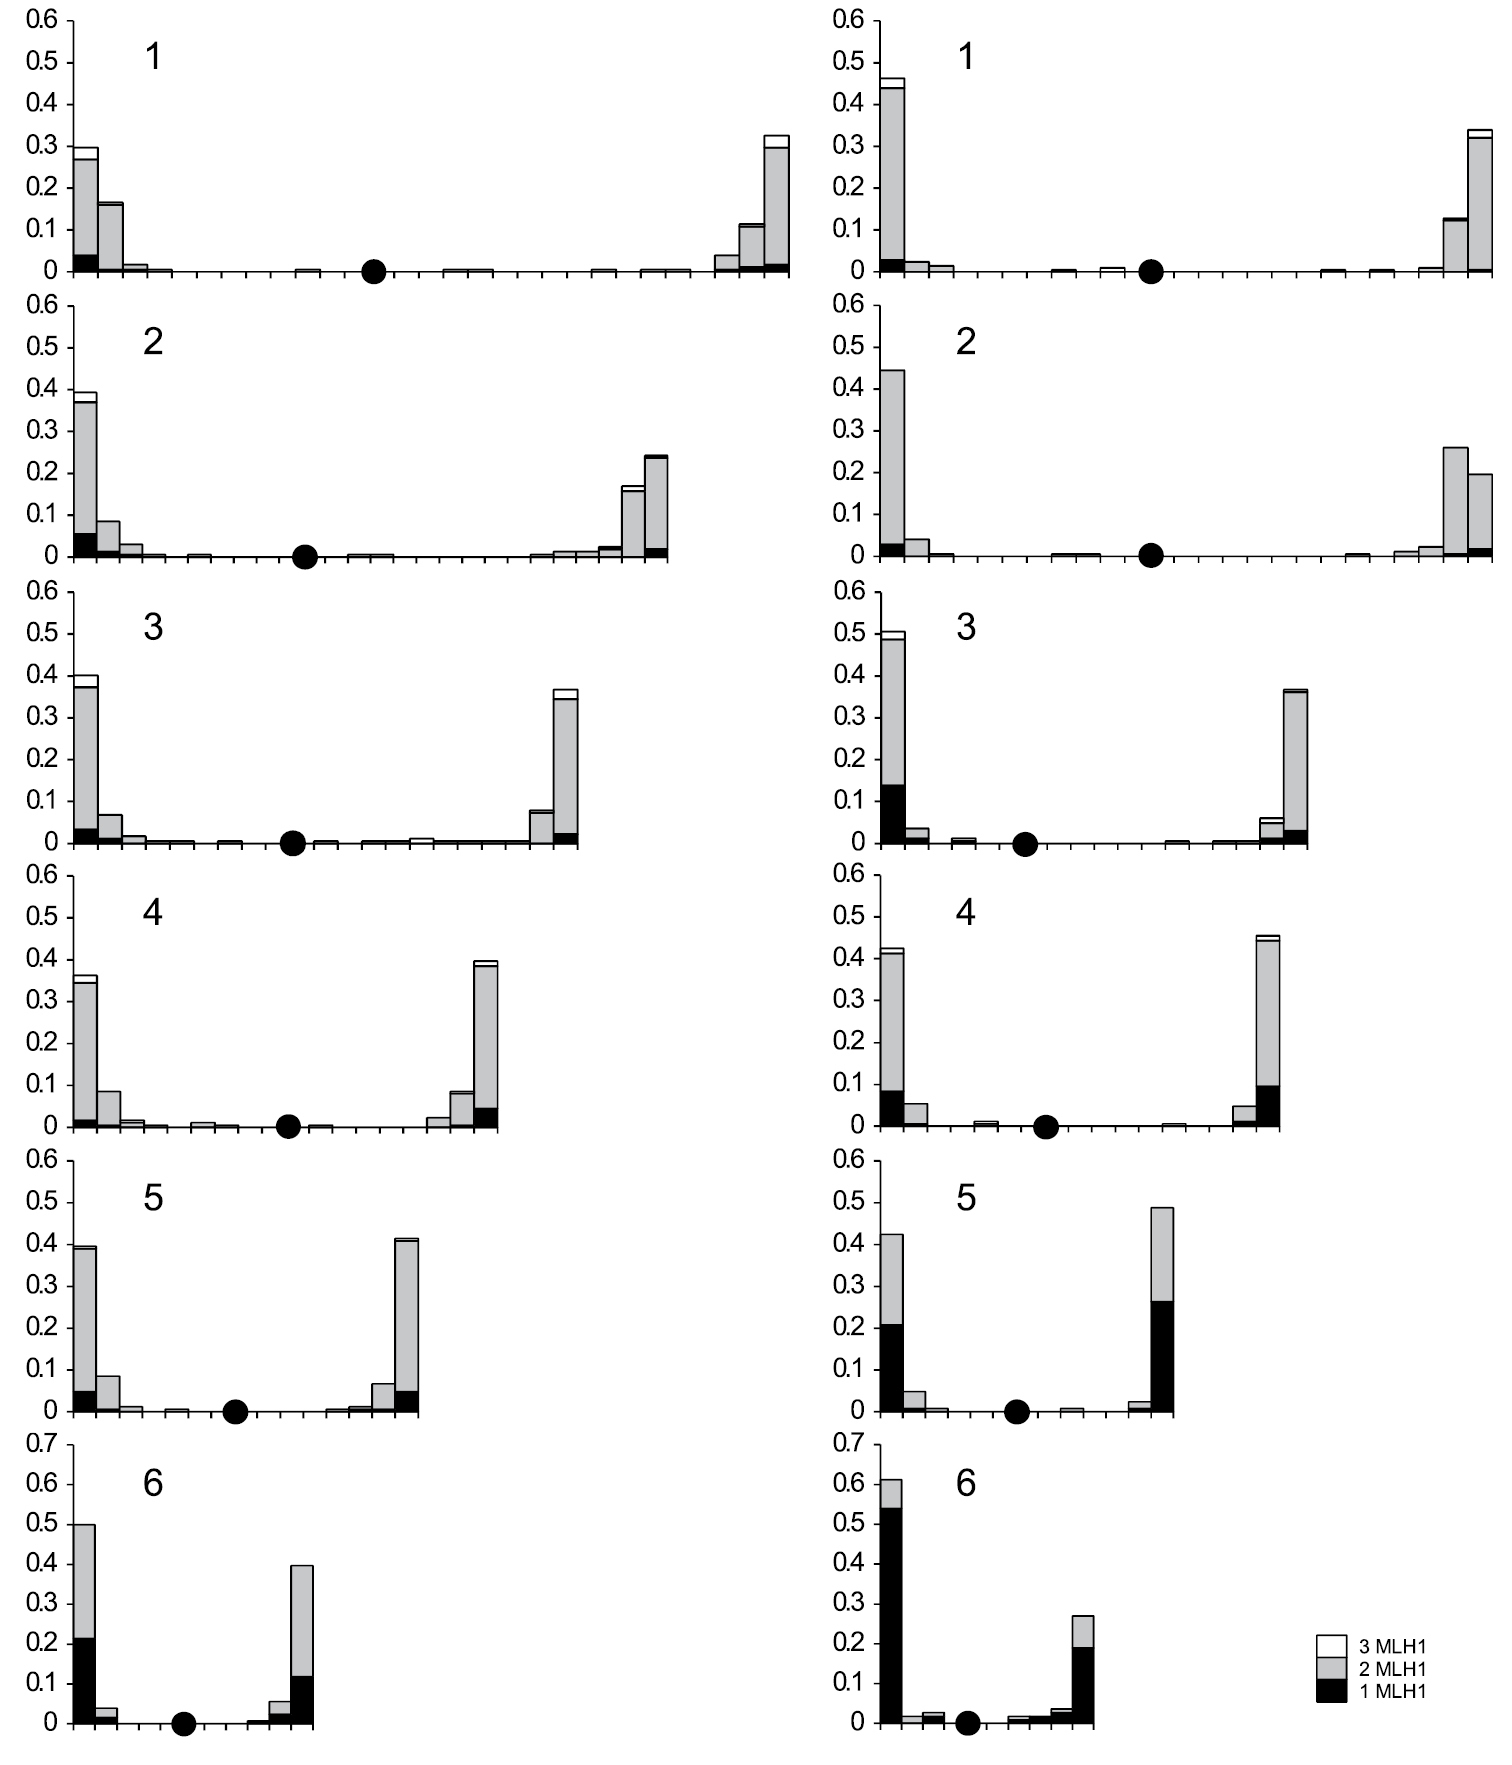
The distribution of MLH1 foci along the macrochromosomes of A. carolinensis and D. coelestinus. The X-axis shows the position of MLH1 foci, the marks on this axis are separated by 1 μm. Black dots indicate centromeres. The Y-axis indicates the frequency of MLH1 foci in each 1 μm – interval. Stacked columns show the frequency for the SCs containing MLH1 foci at each interval. |