|
||
|
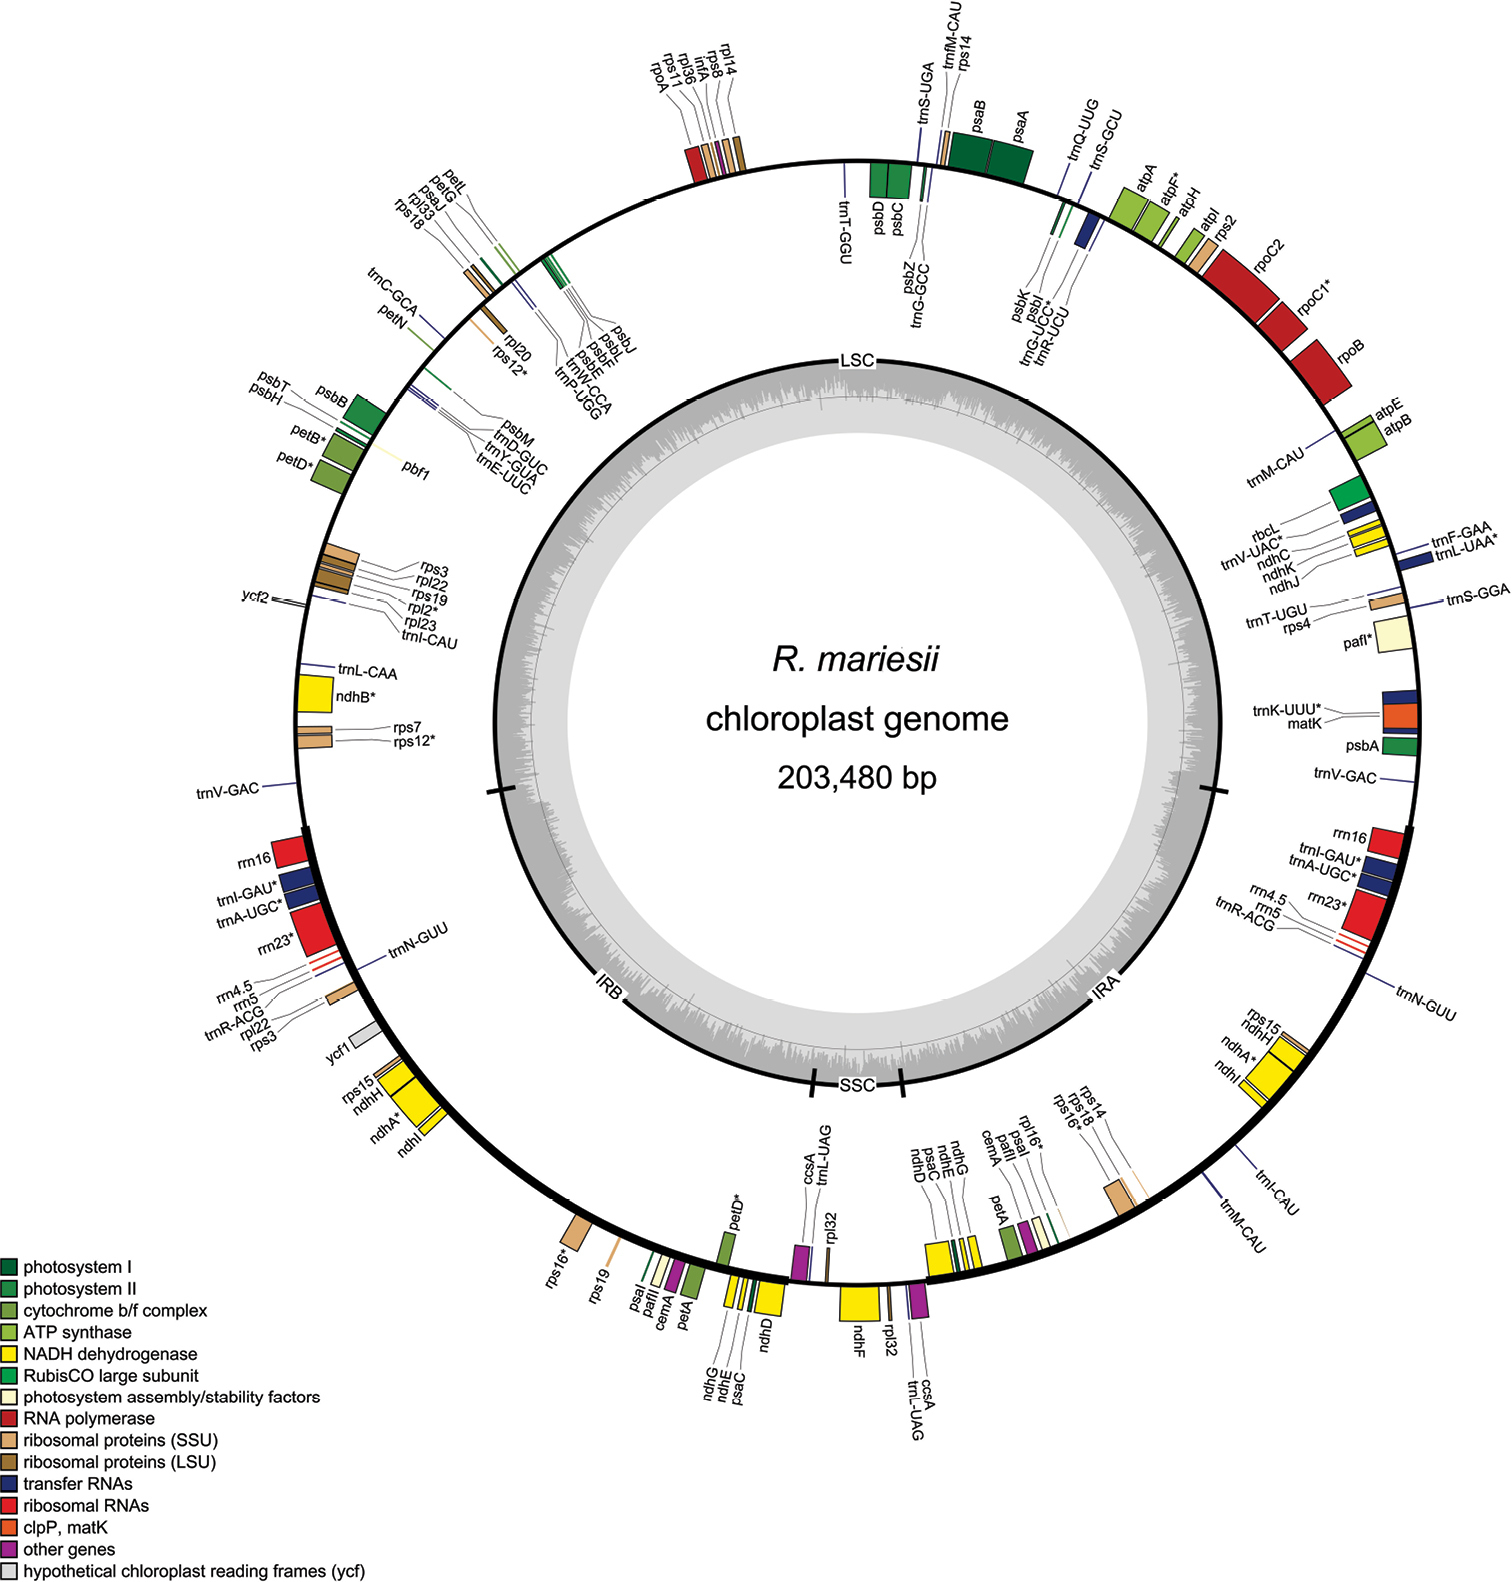
The chloroplast genome map of R. mariesii. Thick lines represented LSC, SSC, and IR regions, respectively. Genes shown inside circle were transcribed counterclockwise, and the outside outer circle were transcribed clockwise. Different gene groups were represented by different colors. |