|
||
|
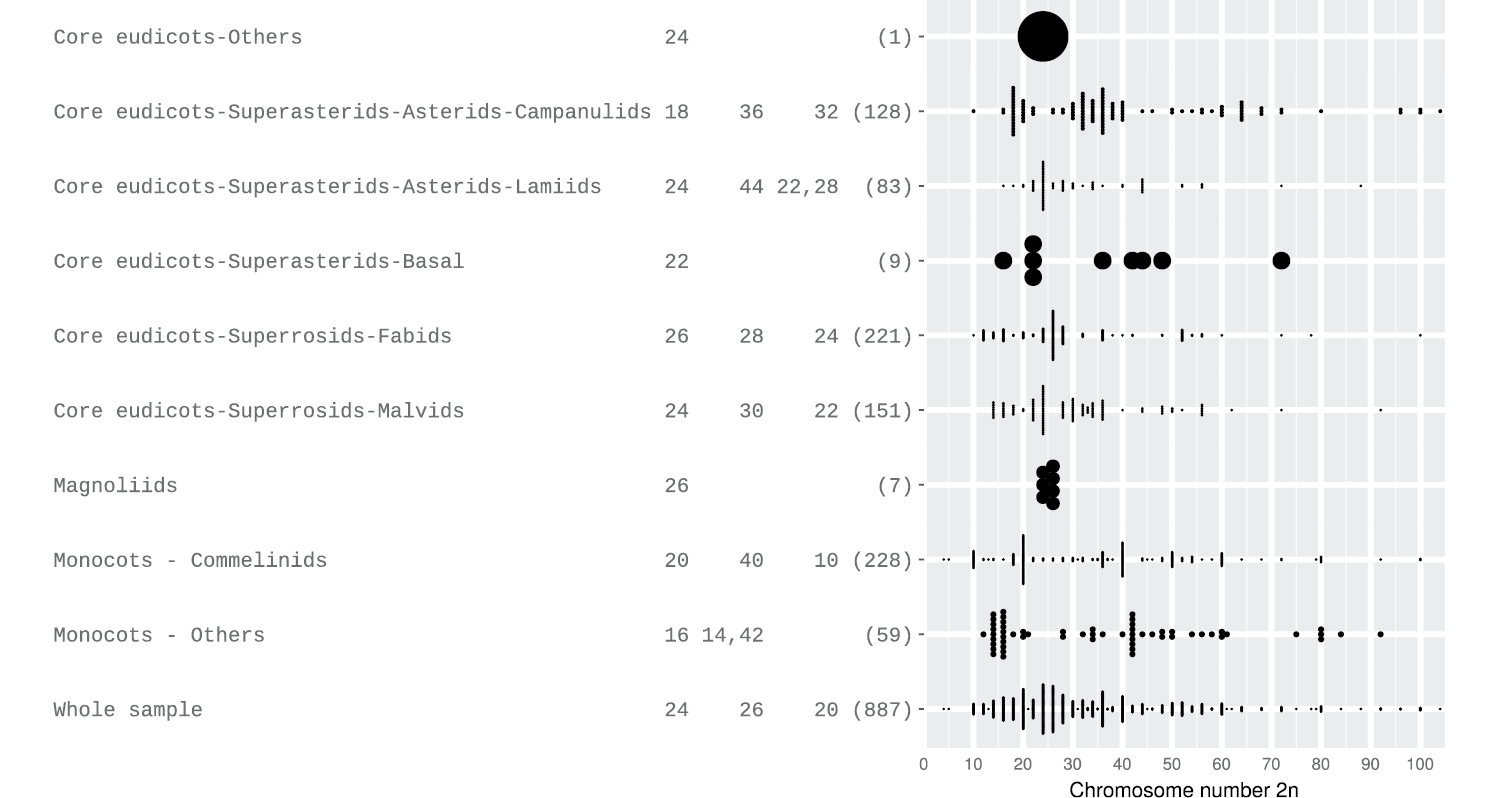
Dot-plot of observed and calculated 2n numbers for Cerrado plant species considering APG major clades. The three most common numbers (frequency ties separated by comma) and sample size in parentheses are indicated. Dot size varies depending on the maximum frequency of each group. |