|
||
|
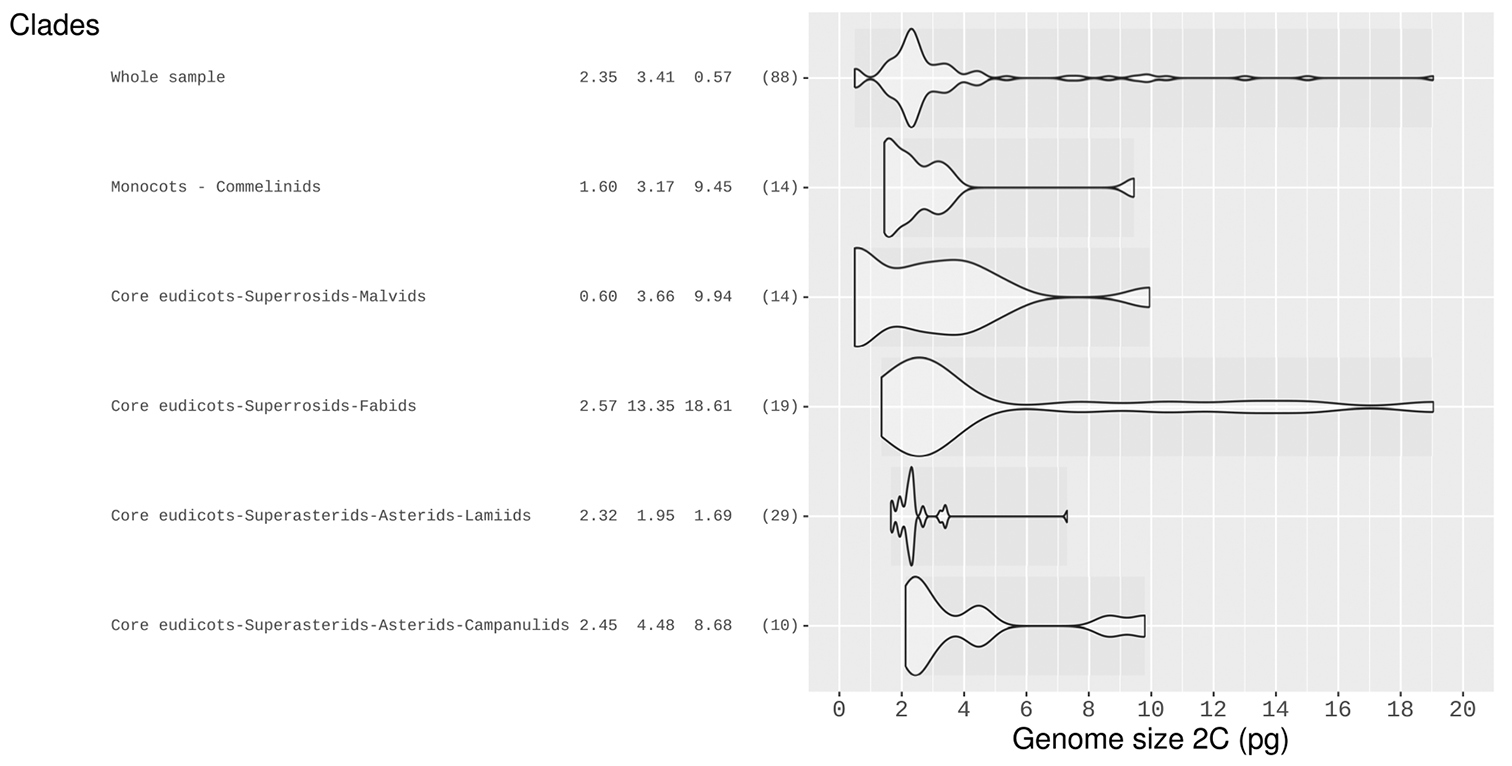
Violin-plots for genome sizes in pg for Cerrado angiosperms. Y-axis contains clades, three highest peaks of the Gaussian kernel density and sample size. Bandwidth of the density estimator customizable in http://cyto.shinyapps.io/cerrado |
|
||||||||
| Part of: Roa F, Telles MPC (2017) The Cerrado (Brazil) plant cytogenetics database. Comparative Cytogenetics 11(2): 285-297. https://doi.org/10.3897/CompCytogen.v11i2.11395 |