|
||
|
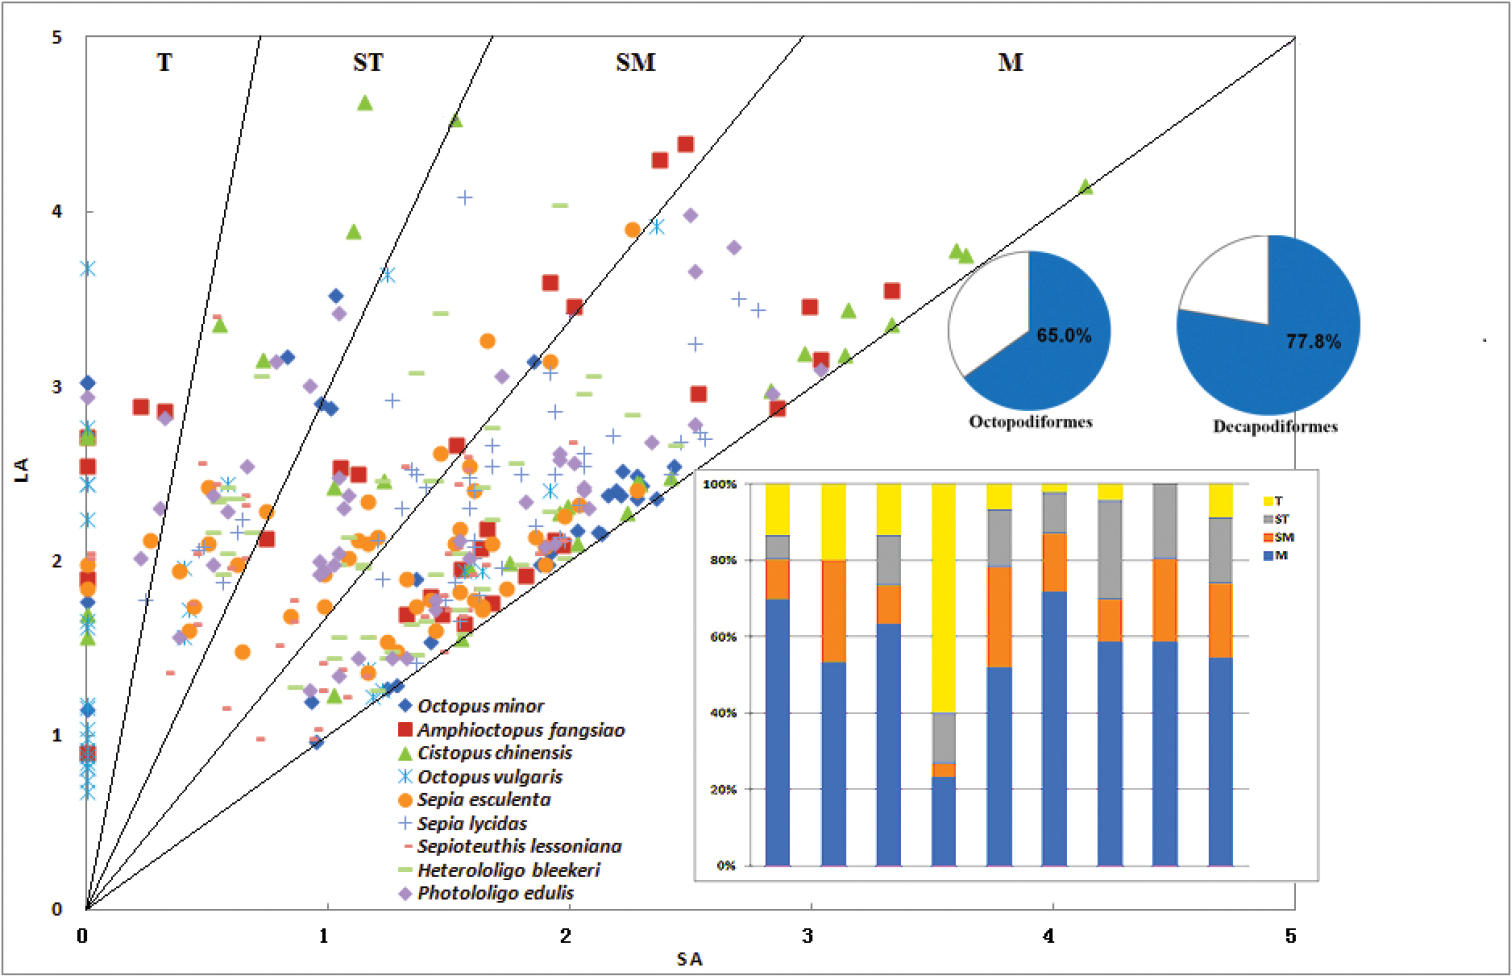
Chromosome distribution diagram of nine species of cephalopods. The slopes of the four lines are 1, 1.7, 3 and 7, dividing the diagram into four zones which represent four types of chromosome. SA, short arm relative length; LA, long arm relative length; M, metacentric; SM, submetacentric; ST, subtelocentric; T, telocentric. The blue area of pie charts and bar charts means M+SM and M, respectively. |