|
||
|
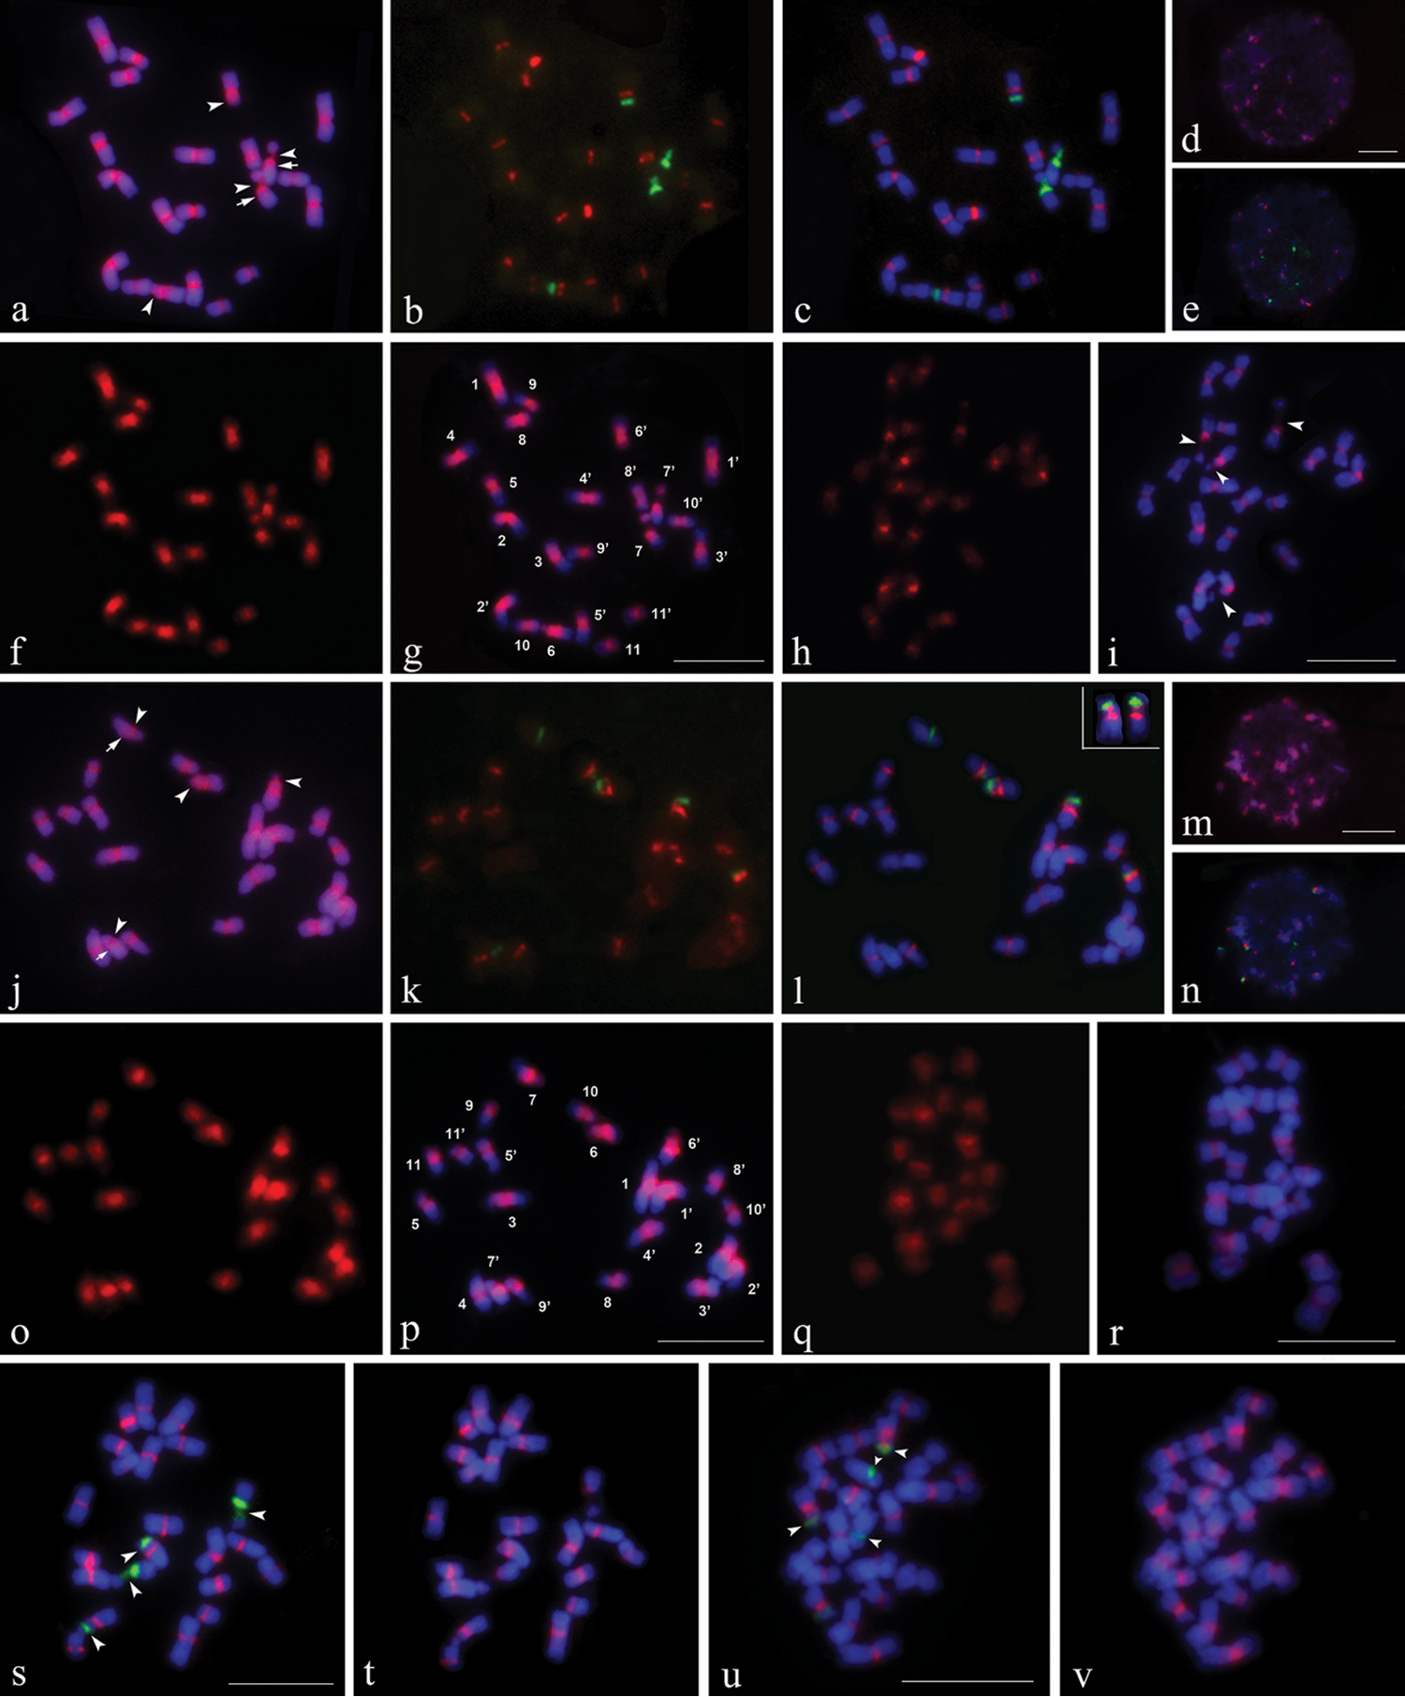
Mitotic chromosomes (except for d, e, m, n) and interphase nuclei (d, e, m and n) of Canavalia gladiata (a–i, s, t) and Canavalia ensiformis (j–r, u, v) after sequential CPD staining and in situ hybridization. a, d, j, m CPD-stained chromosomes and interphase nuclei. c, e, l, n, s, u Chromosomes and interphase nuclei showing 5S (red) and 45S (green) rDNA signals produced by digoxigenin-labeled 5S rDNA and biotin-labeled 45S rDNA probes. b and k 5S and 45S rDNA signals only. f and o Signals produced by digoxigenin-labeled total genomic DNA of their own, g and p Chromosomes with sGISH signals. h and q Signals produced by digoxigenin-labeled total genomic DNA probes from other species. i and r Chromosomes with cGISH signals. t and vFISH of digoxigenin-labeled 5S rDNA repeats cloned from C. gladiata and C. ensiformis to same spreads shown in s and u, respectively. Arrows in a and j indicate positions of pair 7 centromeres. Arrowheads in a, i, j, s and u indicate distinguishable secondary constrictions (SC). Chromosome numbers in g and p are designated by karyotyping. Chromosomes in upper right corner of l are pair 6 from another spread showing proximal 5S rDNA loci on short arms. Chromosomes were counterstained using DAPI (blue). Bars = 10 µm. |