|
||
|
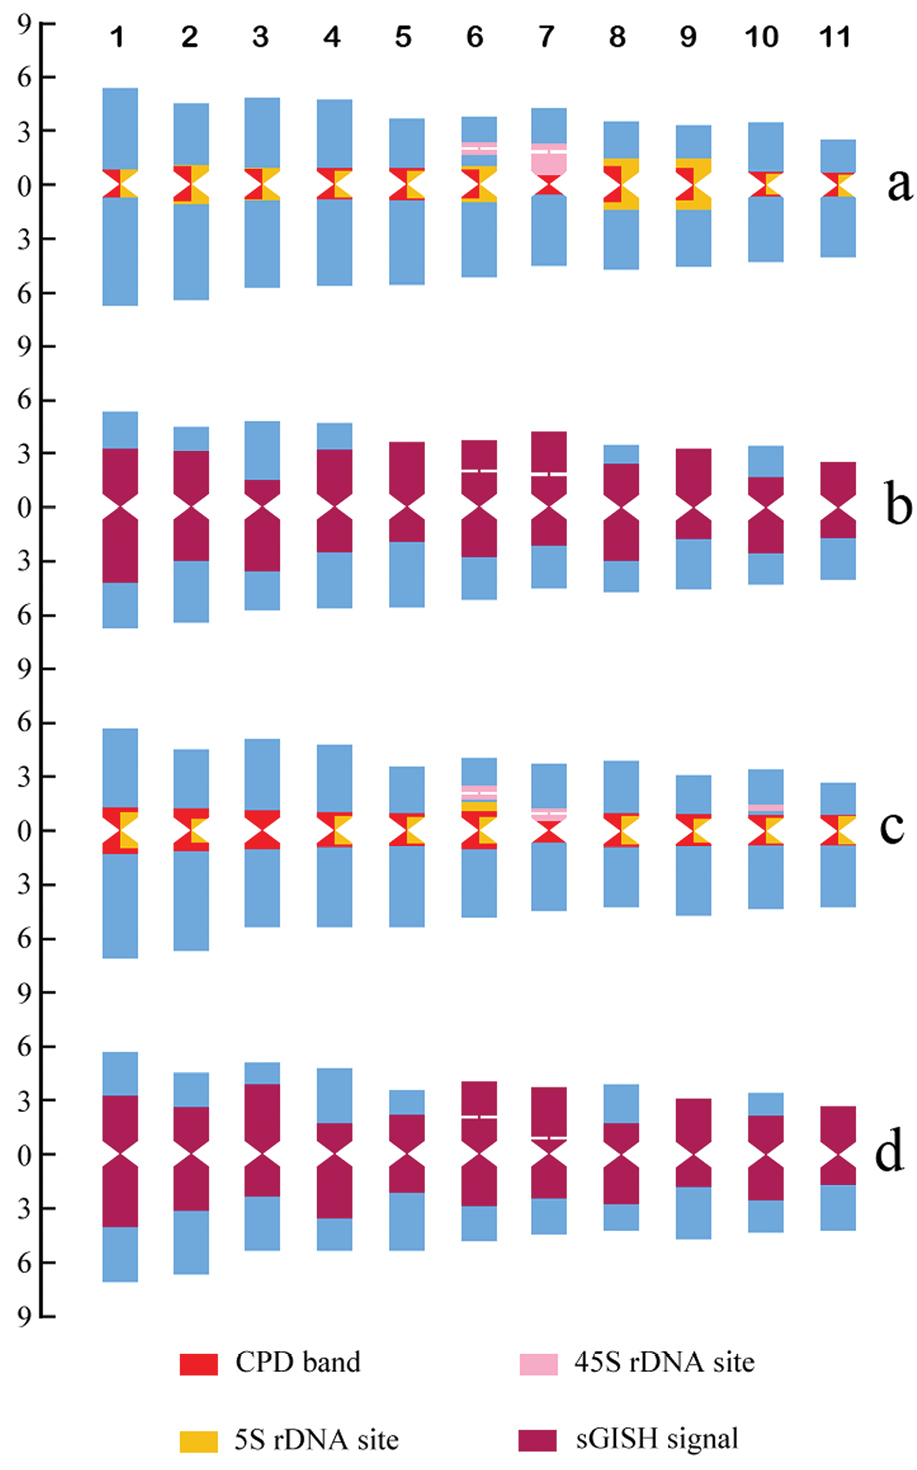
Idiograms of Canavalia gladiata (a, b) and C. ensiformis (c, d). a and c are idiograms displaying chromosome measurements and position and size of fluorochrome bands and rDNA FISH signals, b and d are idiograms displaying chromosome measurements and size and distribution of sGISH signals. Ordinate scale on left indicates relative chromosome length (% of haploid complement). The numbers above panel a are chromosome numbers. |