|
||
|
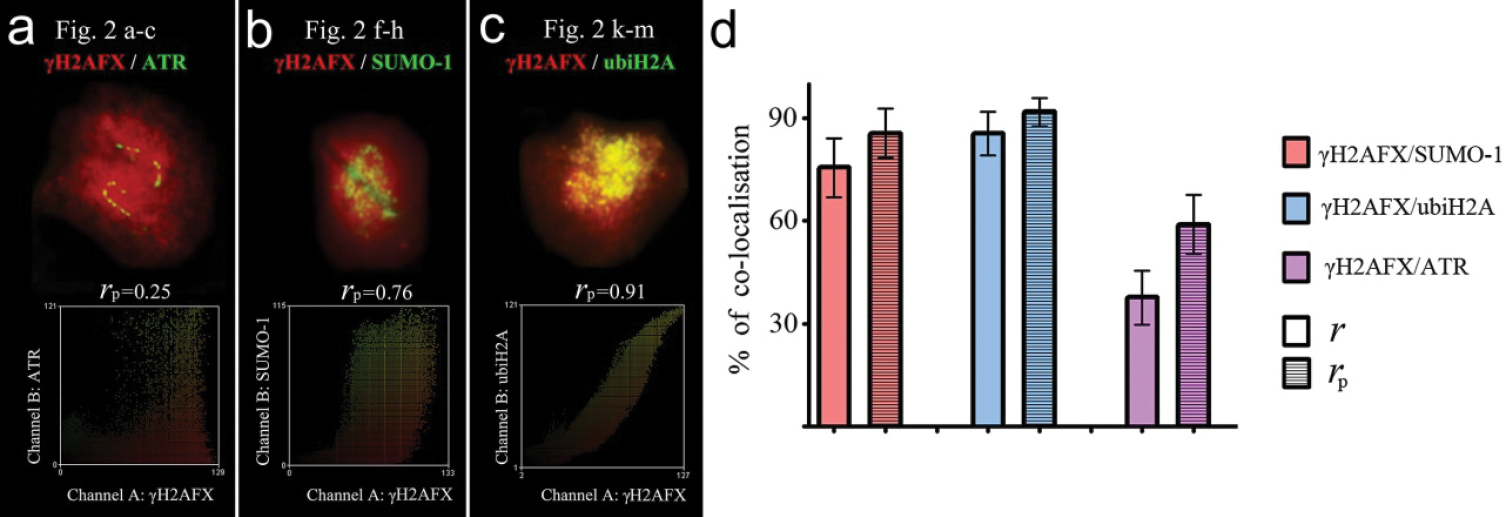
Intensity correlation analysis (ICA) represented by scatter plots showing the paired intensities of two channels (a γH2AFX - ATR, Fig. 2a–cb γH2AFX - SUMO-1, Fig. 2f–hc γH2AFX - ubiH2A Fig. 2k-m). rp - Pearson correlation coefficient. See more details in the text. Degree of co-localisation for signals in sex trivalents of common shrew (d). On the y-axis, the percentage of co-localised signals are shown according to overlap correlation coefficients (r) and the Pearson correlation coefficient (rp). |