|
||
|
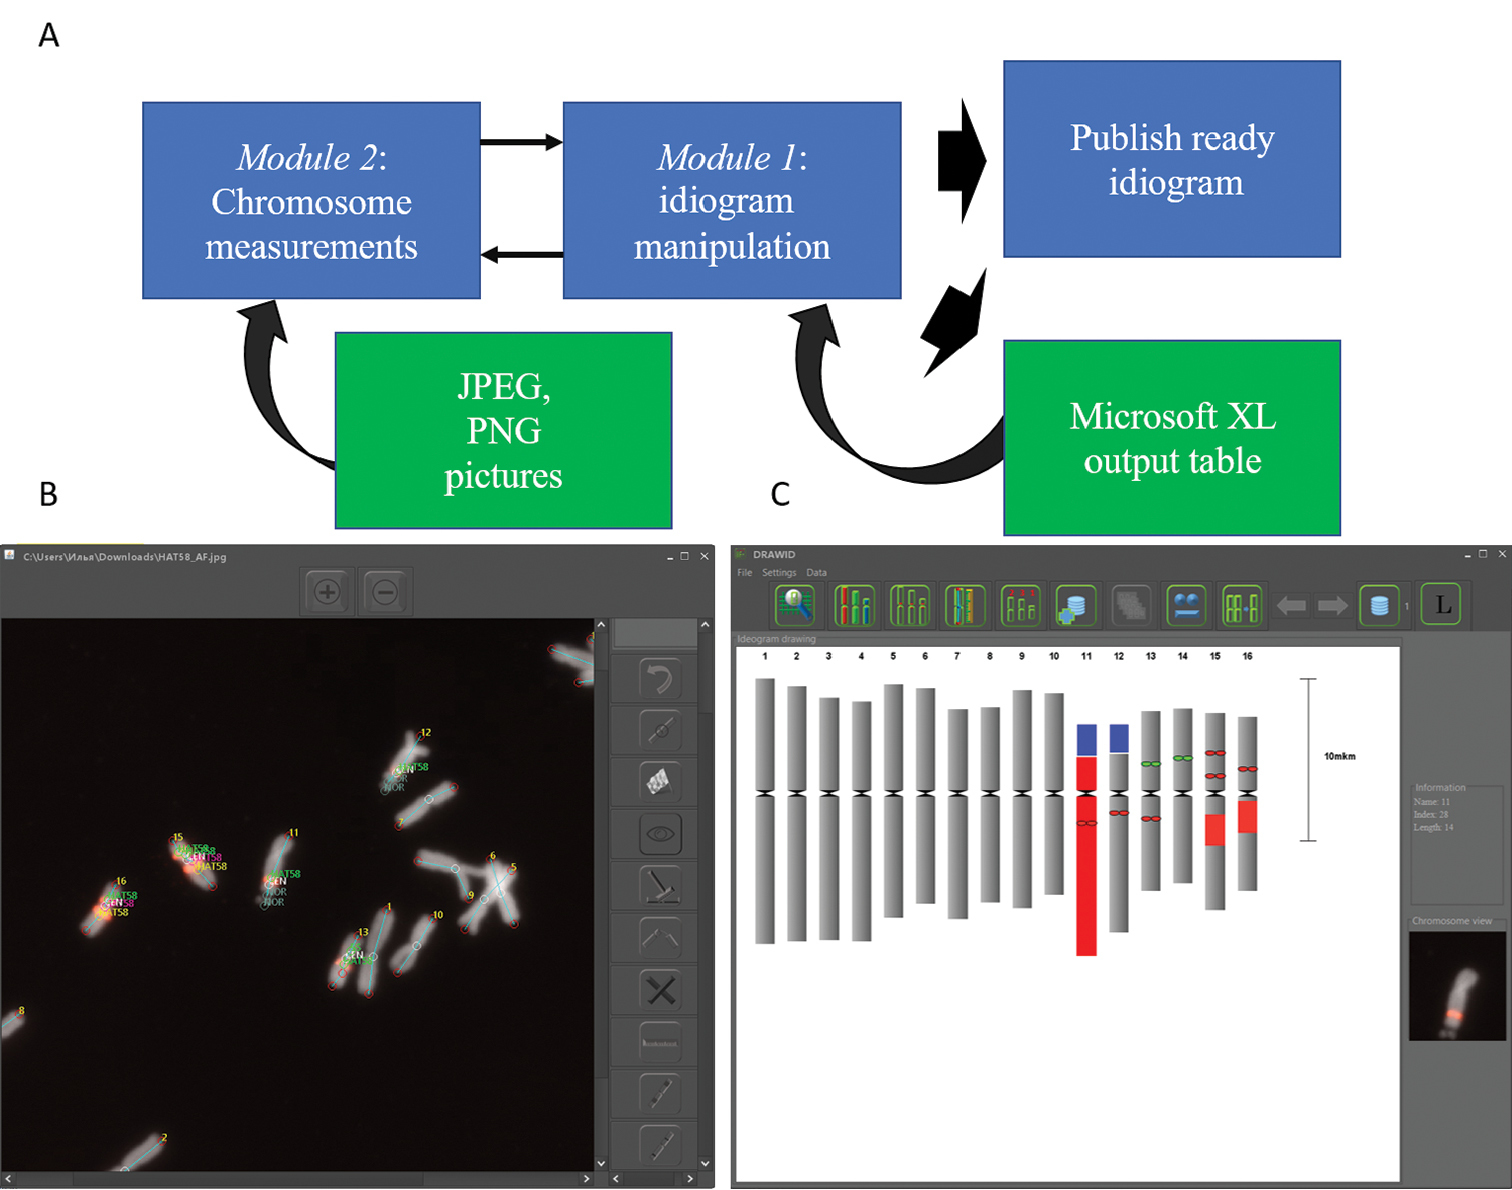
Structure (A) and main windows of DRAWID (B, C). B Interface of chromosome measurement window, containing useful tools for chromosome and FISH/GISH signal measurements. The photograph in this panel shows the result of a FISH experiment on chromosomes of Allium fistulosum with biotin-labeled 5S rDNA and HAT58 repeat (Kirov et al. 2017). Lines and signatures show the path of chromosome and signal measuring C Interface for idiogram manipulation. This panel shows the idiogram of A. fistulosum constructed based on chromosome measurements and FISH (5S rDNA and HAT58 tandem repeat) signal positions in panel B Buttons at the top of the panel are used for chromosome and centromere color changing, display legend, chromosome order correction and idiogram storage manipulation. When a chromosome in the constructed idiogram is selected (entire chromosome 11 highlighted in red the image of the selected chromosome along with the parameters of its measurement appear on the screen (on the right of the panel C). |