|
||
|
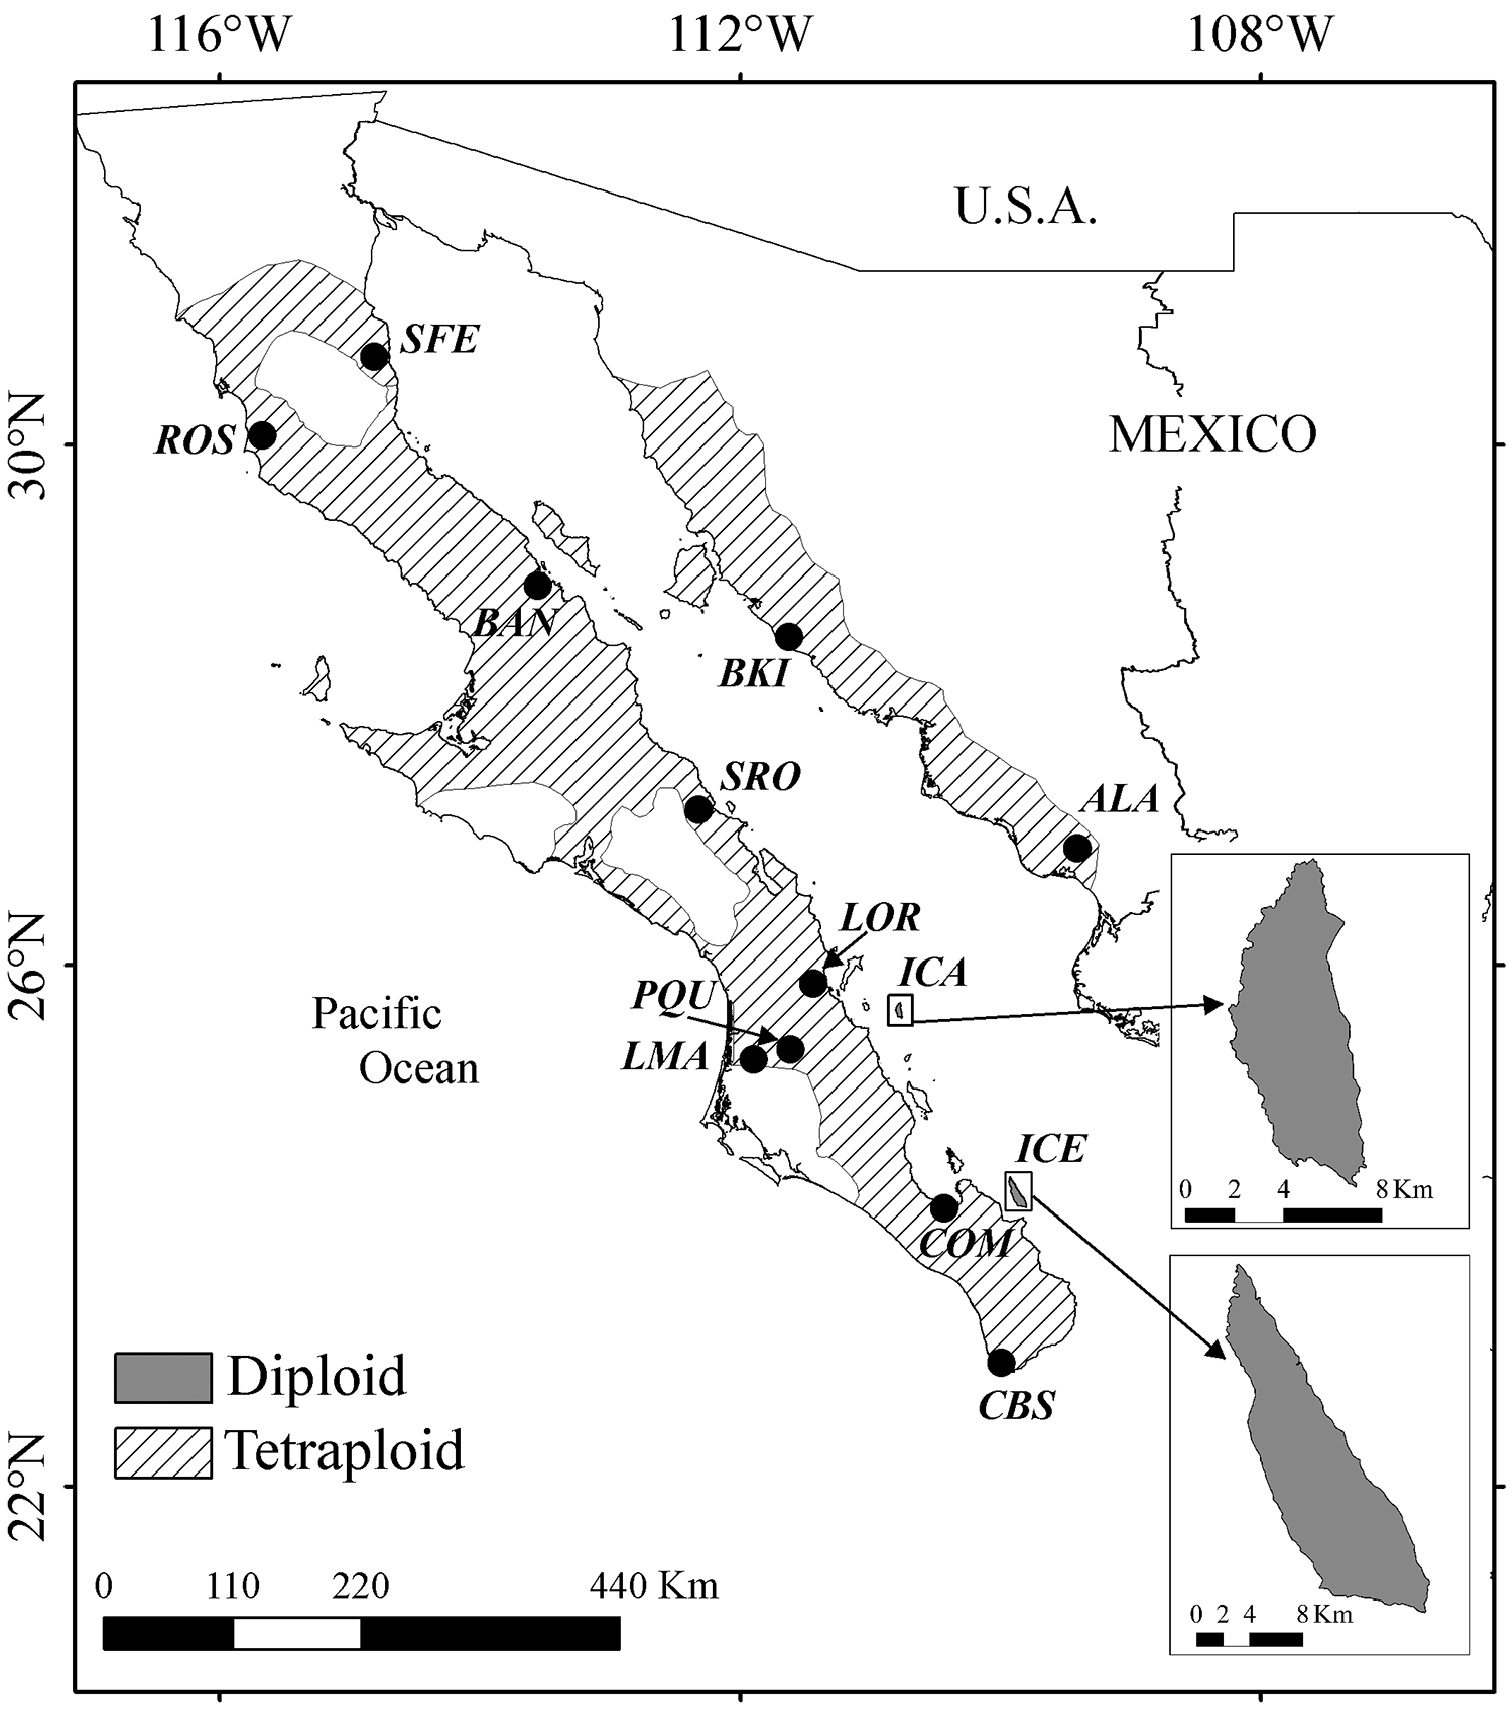
Distribution of diploid and tetraploid individuals in populations (black dots) of Pachycereus pringlei. Dark gray areas in ICA and ICE indicate distribution of diploid (2n = 22) cytotypes. Diagonal shaded area indicates the predicted coverage of tetraploid (2n = 44) cytotypes. See Table 1 for full names of the abbreviated localities indicated in the map. |