|
||
|
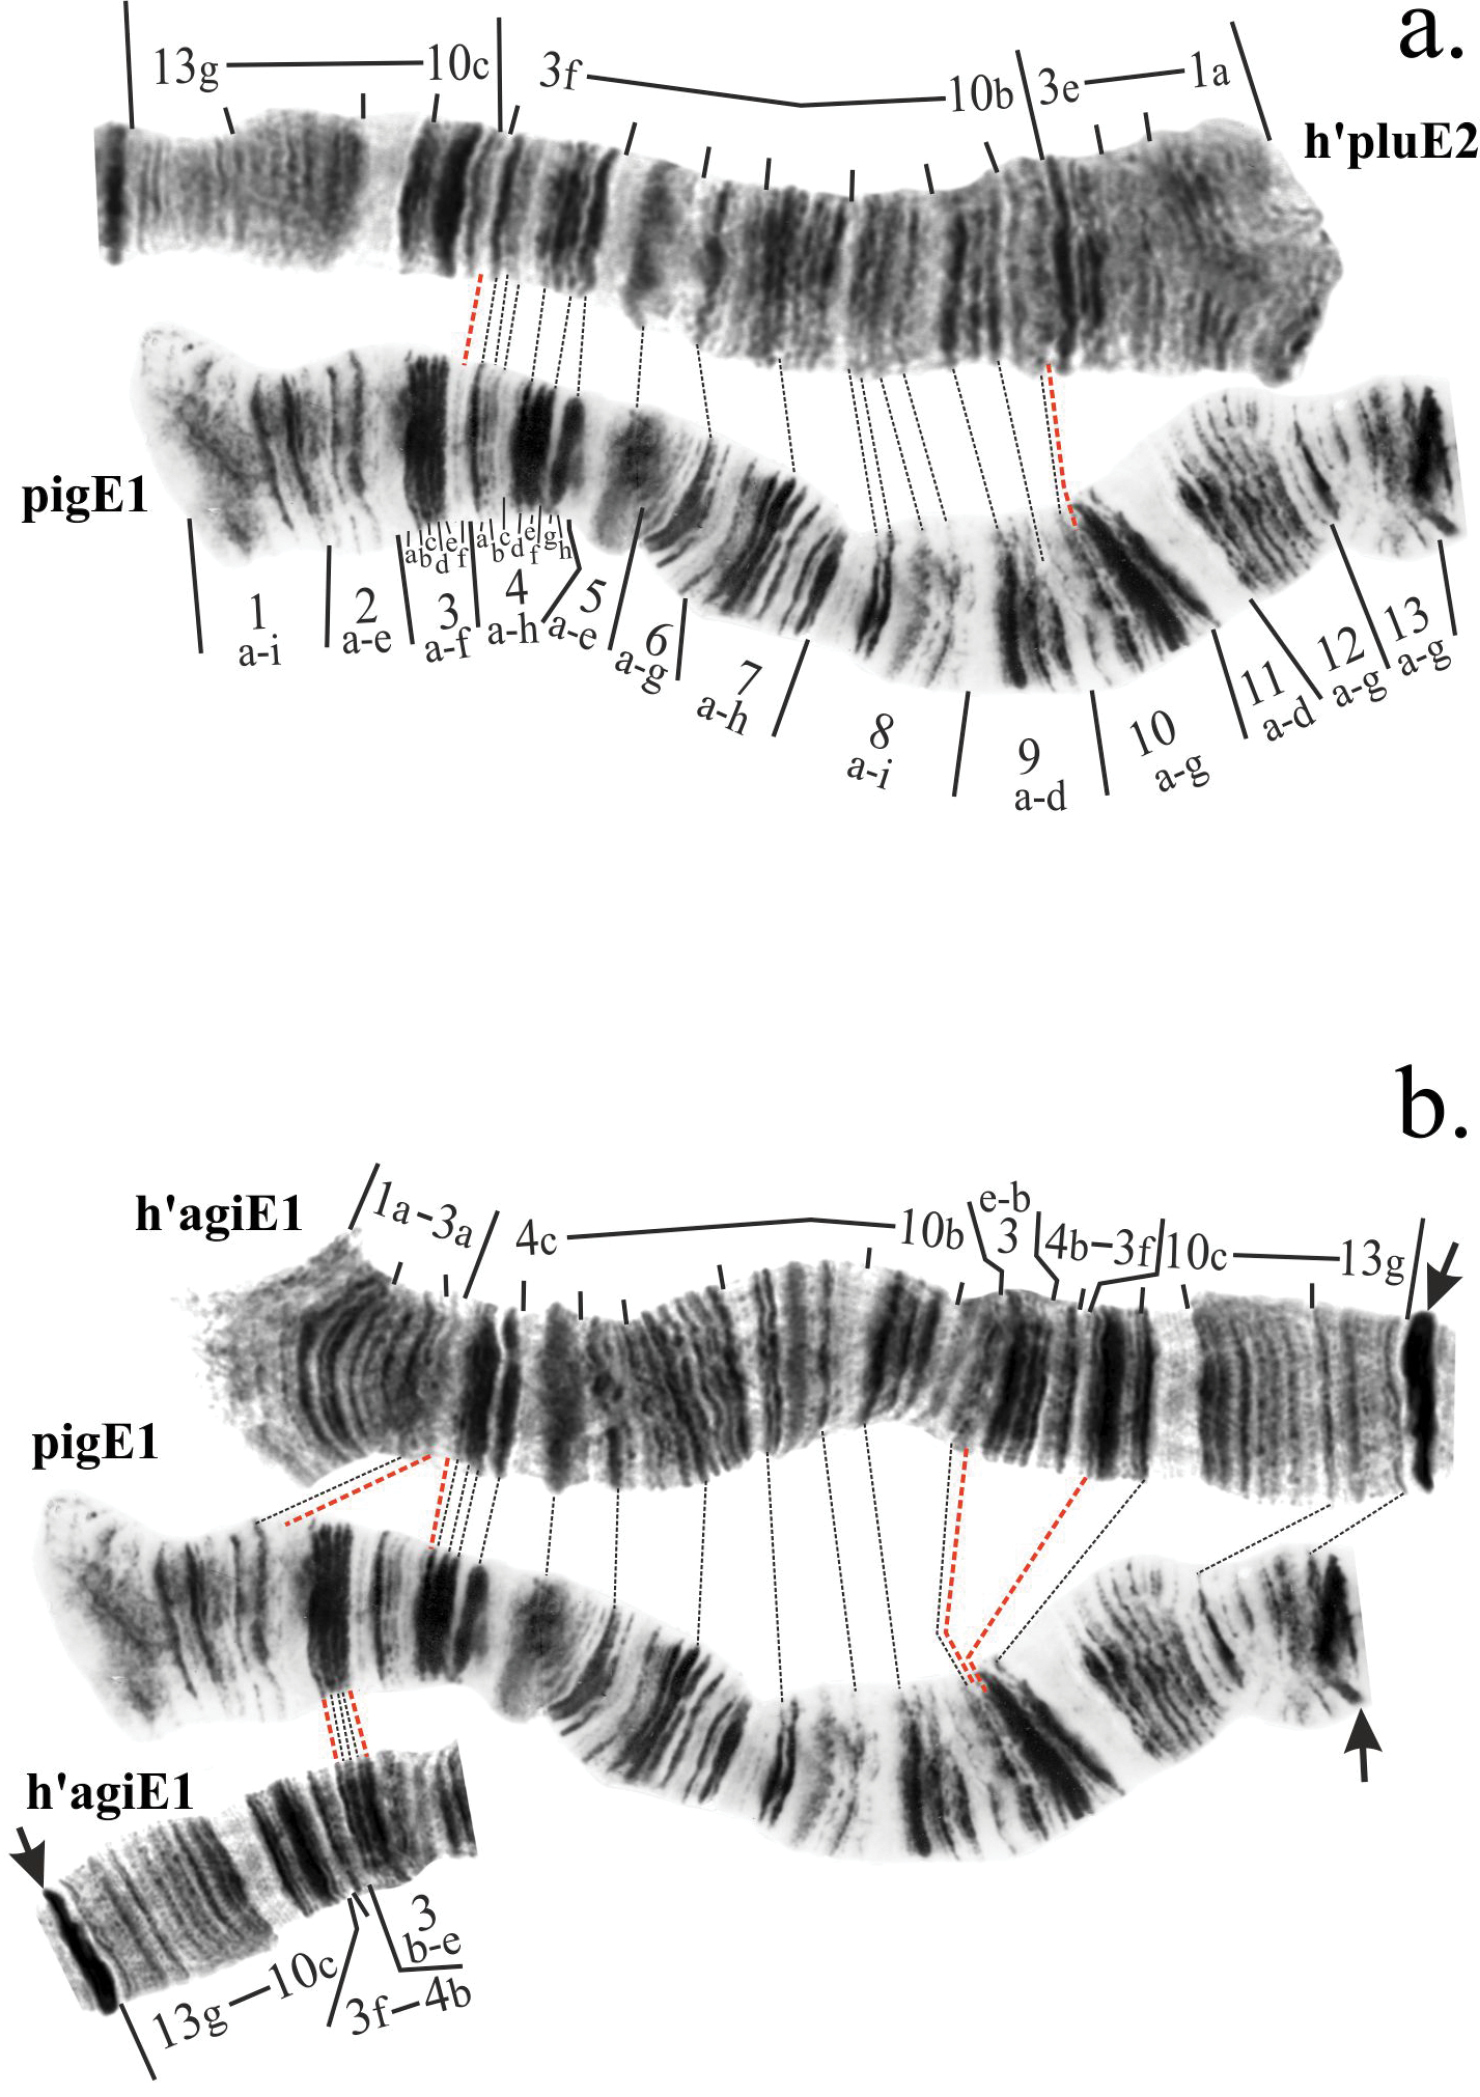
Mapping comparison of banding sequences h’pigE1, h’pluE2 and h’agiA1 (identical to h’pluE1). a – comparison of h’pigE1 and h’pluE2, b – comparison of h’pigE1 and h’agiE1=h’pluE1. Centromeric bands are designated by arrows. Individual band in regions 3 and 4 of h’pigE1 are marked by small letters. Dotted lines connect identical discs in compared banding sequences. Red dotted lines indicate borders of regions, where banding patterns of compared banding sequences are identical. |