|
||
|
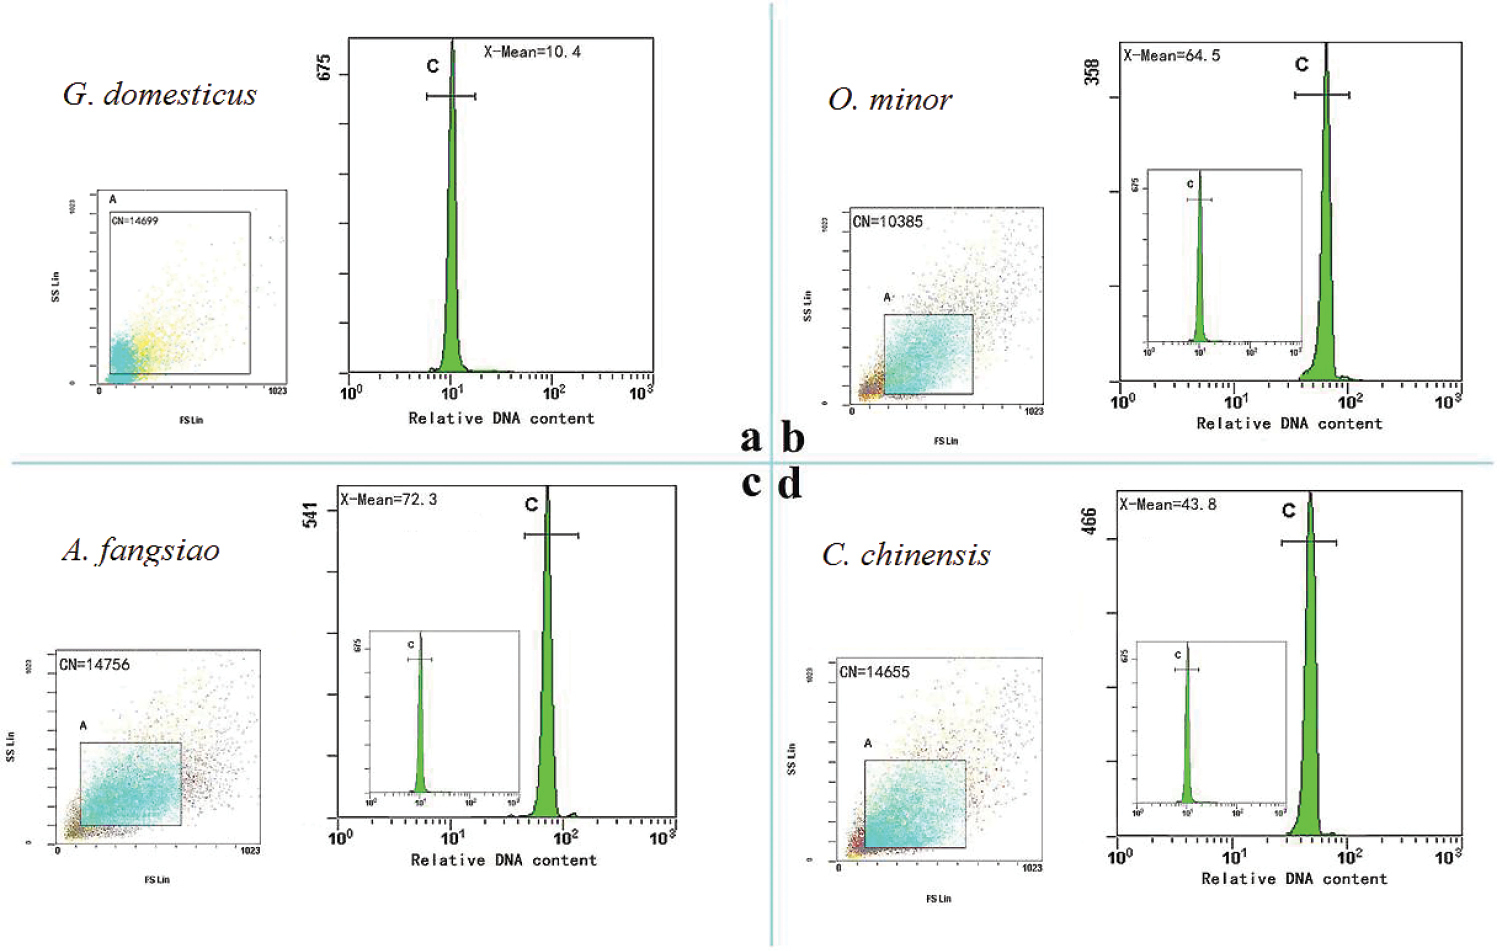
Flow cytometry profiles of relative fluorescence intensity of propidium iodide (PI) in octopus hemocytes of b O. minor c A. fangsiao and d C. chinensis with G. domesticus a as standard (St). Scatter plots display the quality and number of cell mass of standard samples and test samples, and the peak figures show the relative DNA content of each sample. b, c and d are just a representative graph of the three species of octopus samples. CN, the number of cells; X-MEAN, mean fluorescence intensity. |