|
||
|
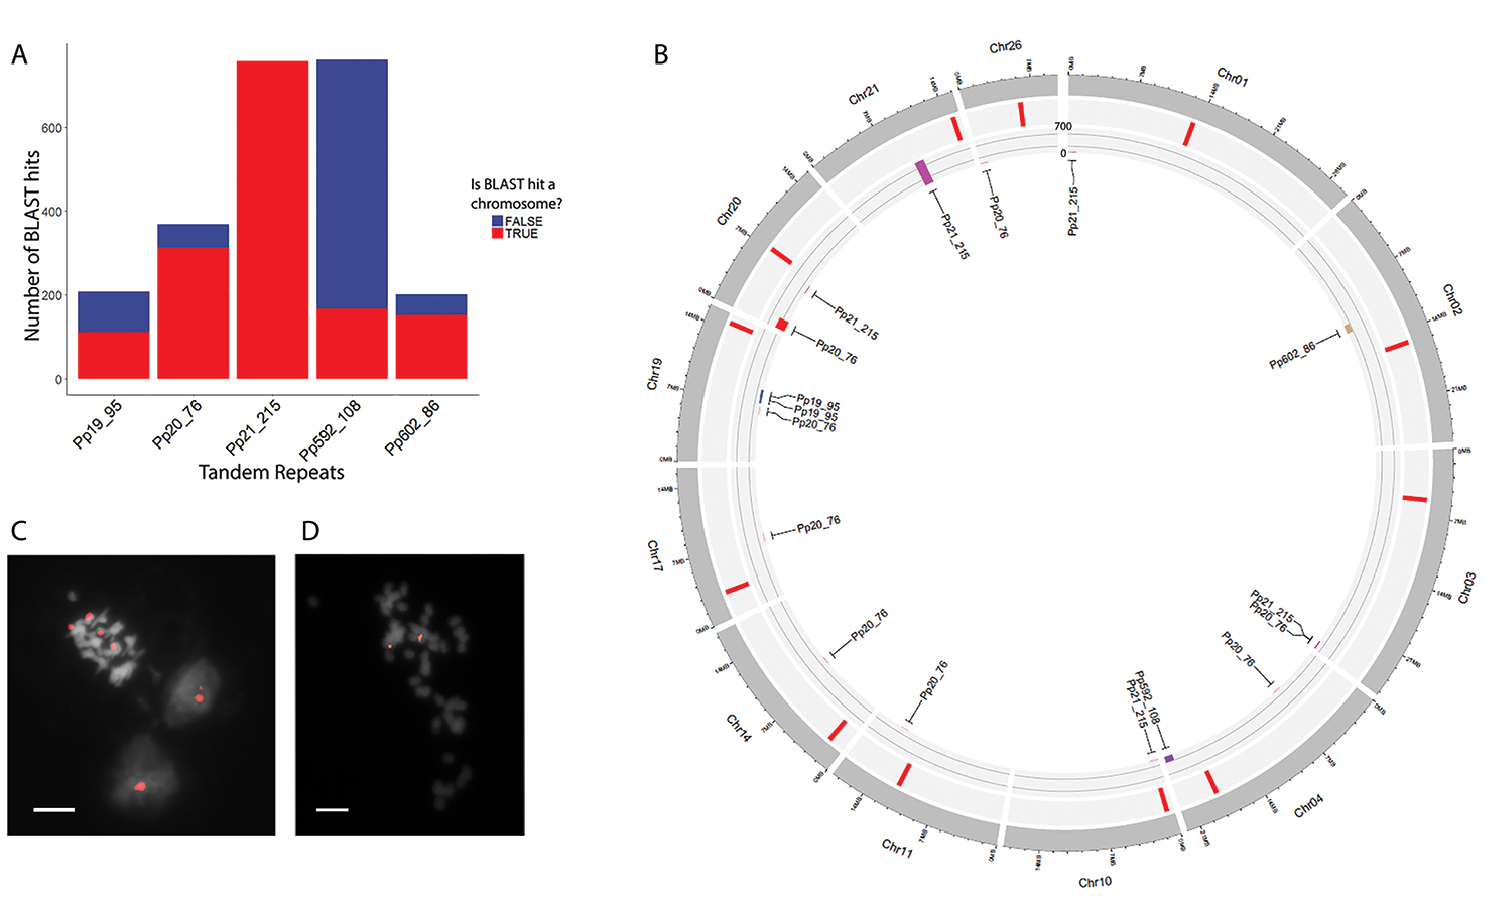
Chromosome location of 5 TRs. A Bar plot showing the number of BLAST hits derived from scaffolds and chromosome sequences B Circos plot: the inner layer corresponds to the bar plot showing the number of BLAST hits of the TRs on the chromosomes; FISH localization of Pp20_76 (C) and Pp602_86 (D). Scale bar: 5 µm. |