|
||
|
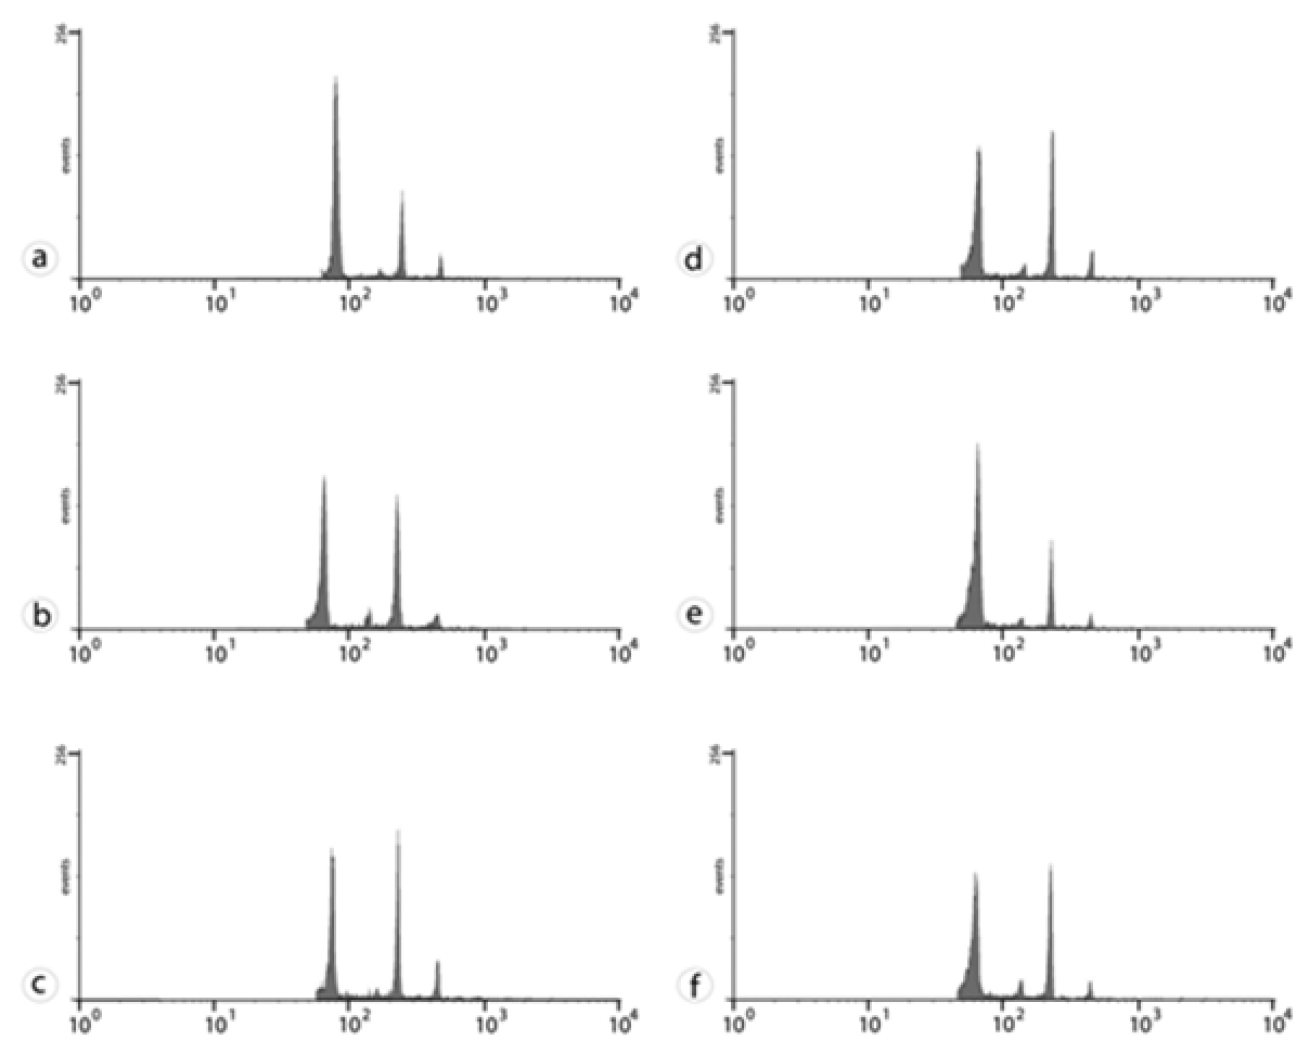
Flow cytometry histograms. P. amboinicus (A), P. grandis (B), P. neochilus (C), P. barbatus (D–F) from UFLA(D), IAC(E), UFSM(F). The first peak in each histogram refers to the G1 peak of each of the Plectranthus species, and the second G1 peak corresponds to the reference sample (Pisum sativum). The abscissa represents the DNA amount, and the ordinate the number of nuclei. |