|
||
|
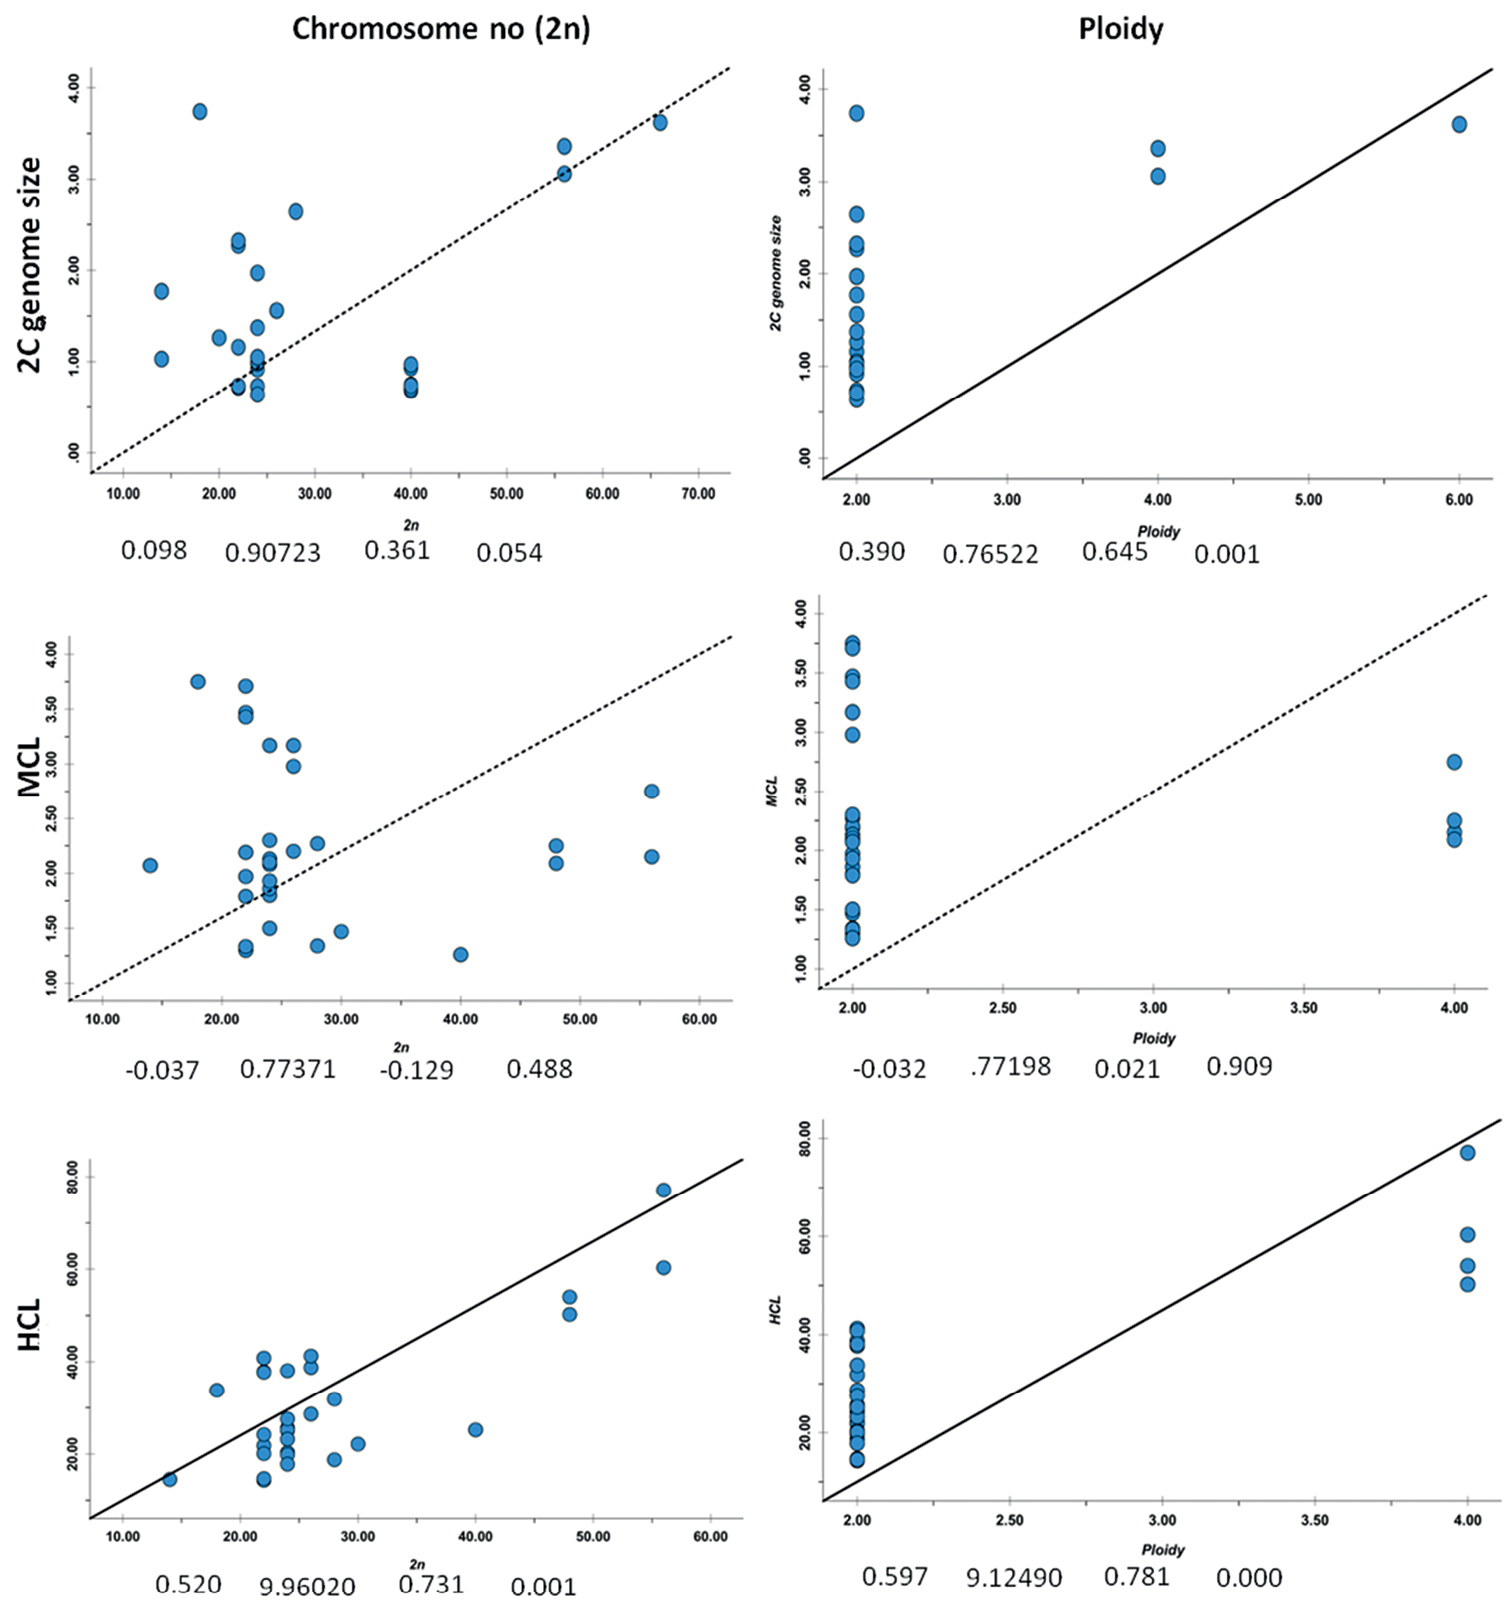
Scatter plots of 2n chromosome number and ploidy level (predictor variables) versus 2C genome size, MCL (mean chromosome length) and HCL (total length of haploid chromosome set) in Cucurbitaceae taxa. Symbols below plots depict regression analysis parameters; square: adjusted R square, circle: standard error of the estimate, triangle: Pearson Correlation, star: 2-tailed significance of Pearson Correlation. Regular lines indicate significant linear regression and dotted lines indicate not significant linear regress |