|
||
|
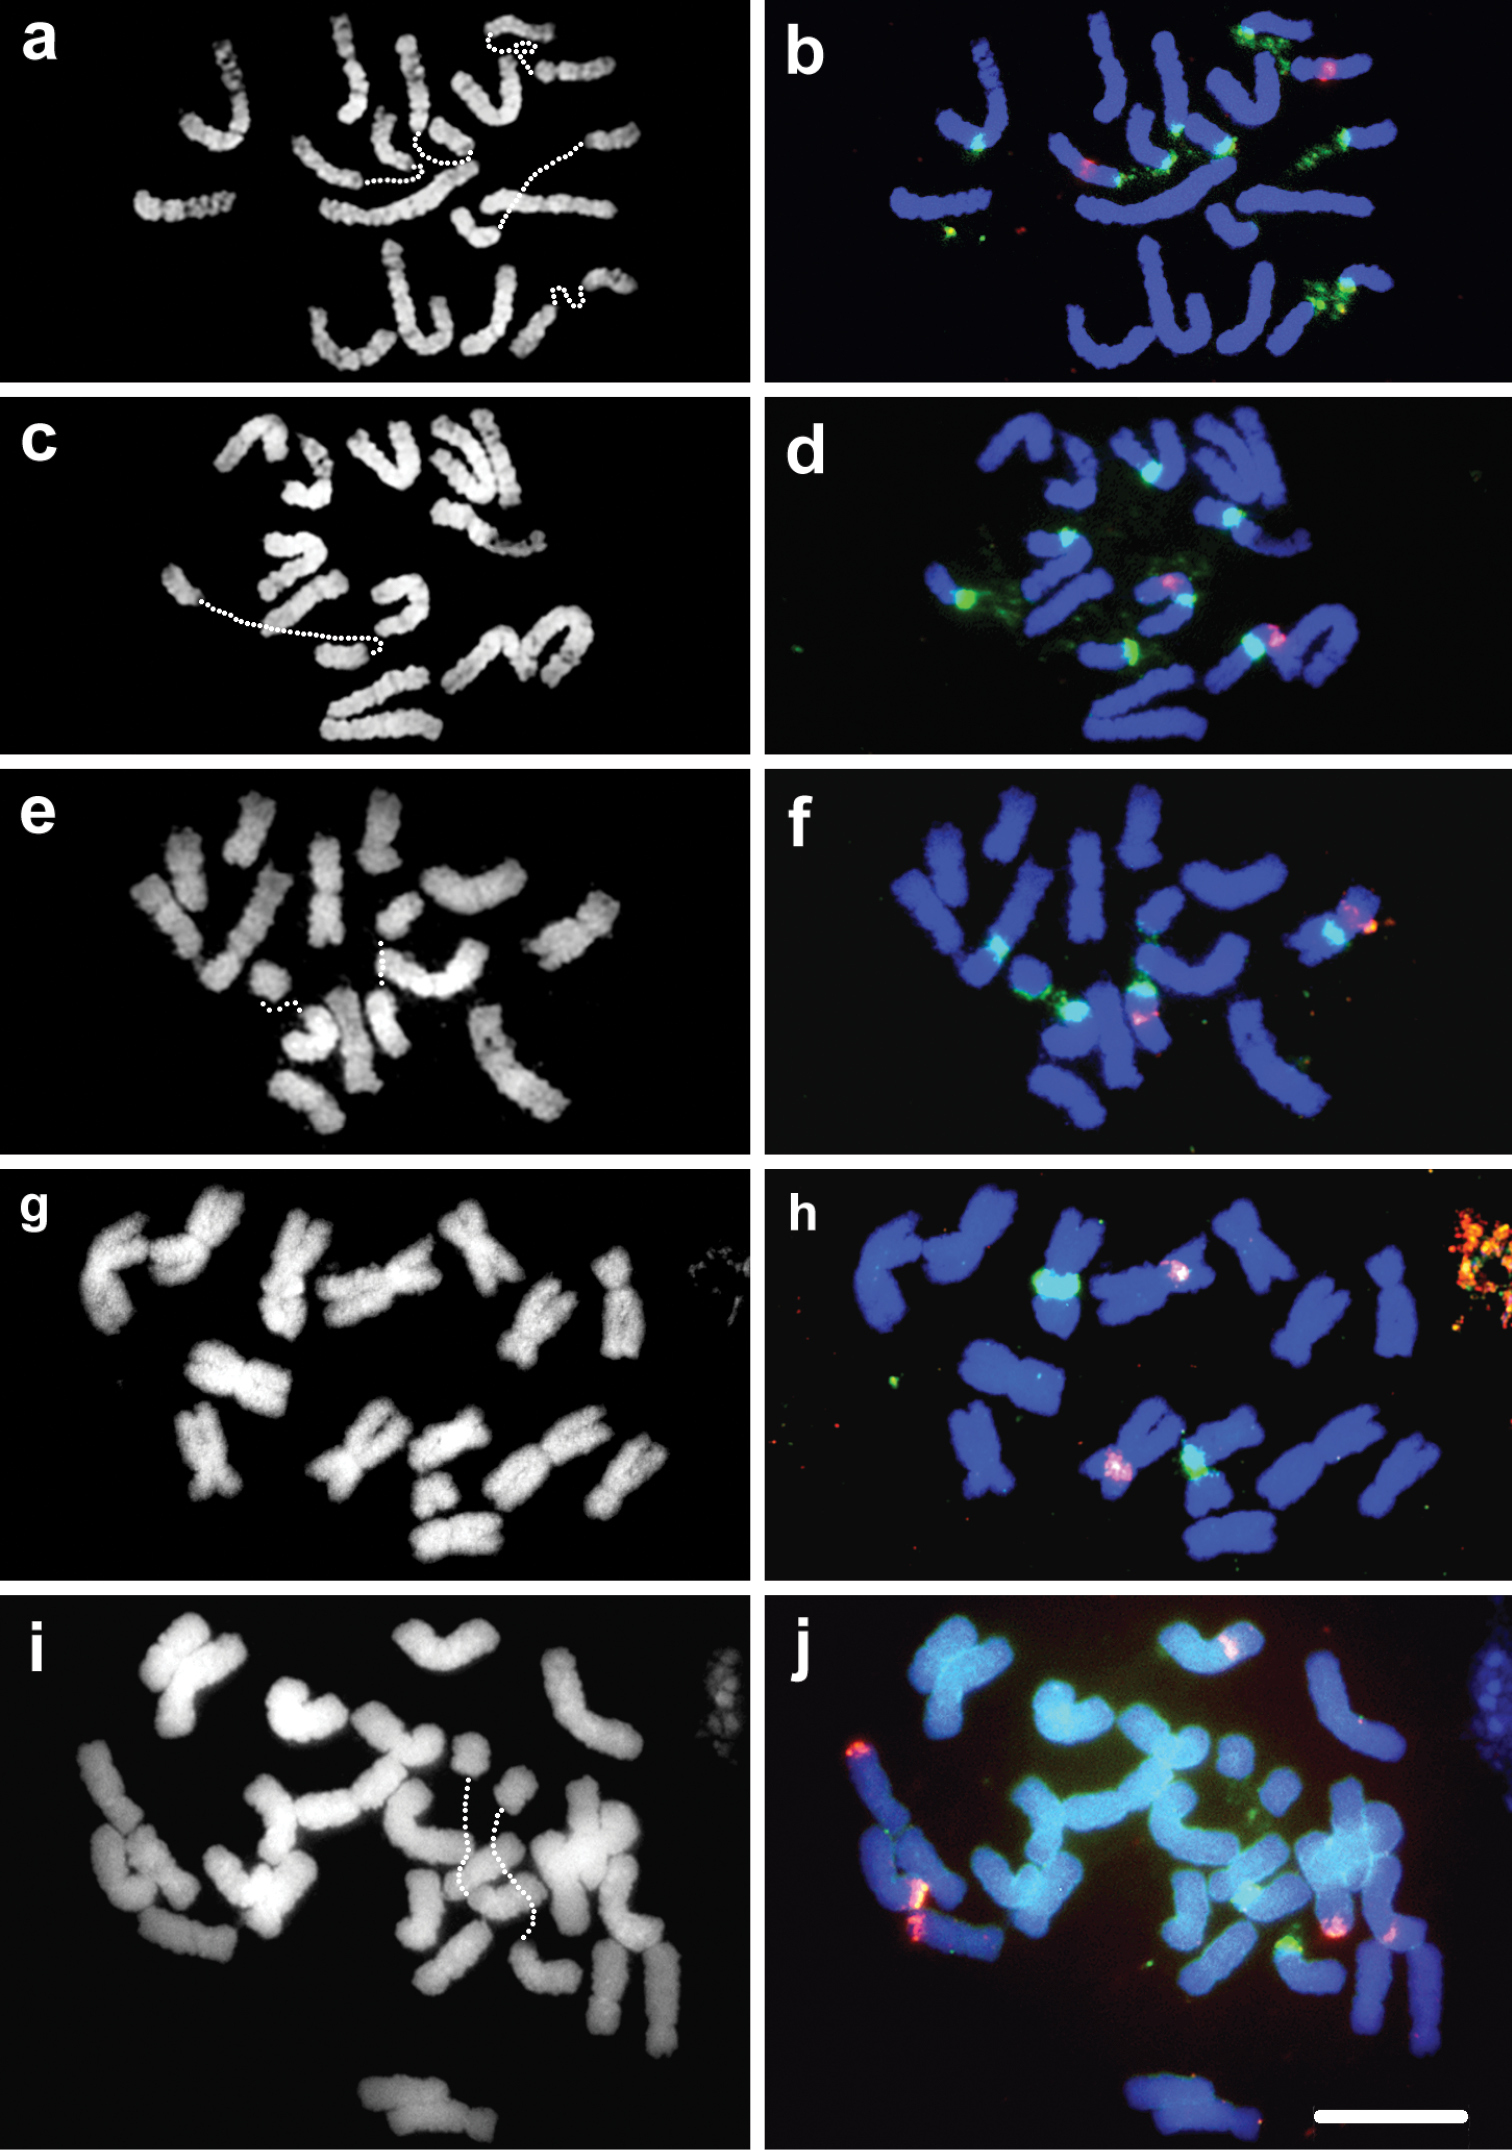
DAPI stained (grey scale) metaphase cells in the left column and the same cells in the right column displaying FISH mapping of 5S (red signals) and 35S rDNA sequences (green signals) in a, b L. perenne c, d L. multiflorum, European origin e, f L. multiflorum MRCN Moroccan origin g, h M. tuberosa i, j F. simensis. Dotted lines in a, c, e, g, and i denote decondensed 35S rDNA chromatin. |