|
||
|
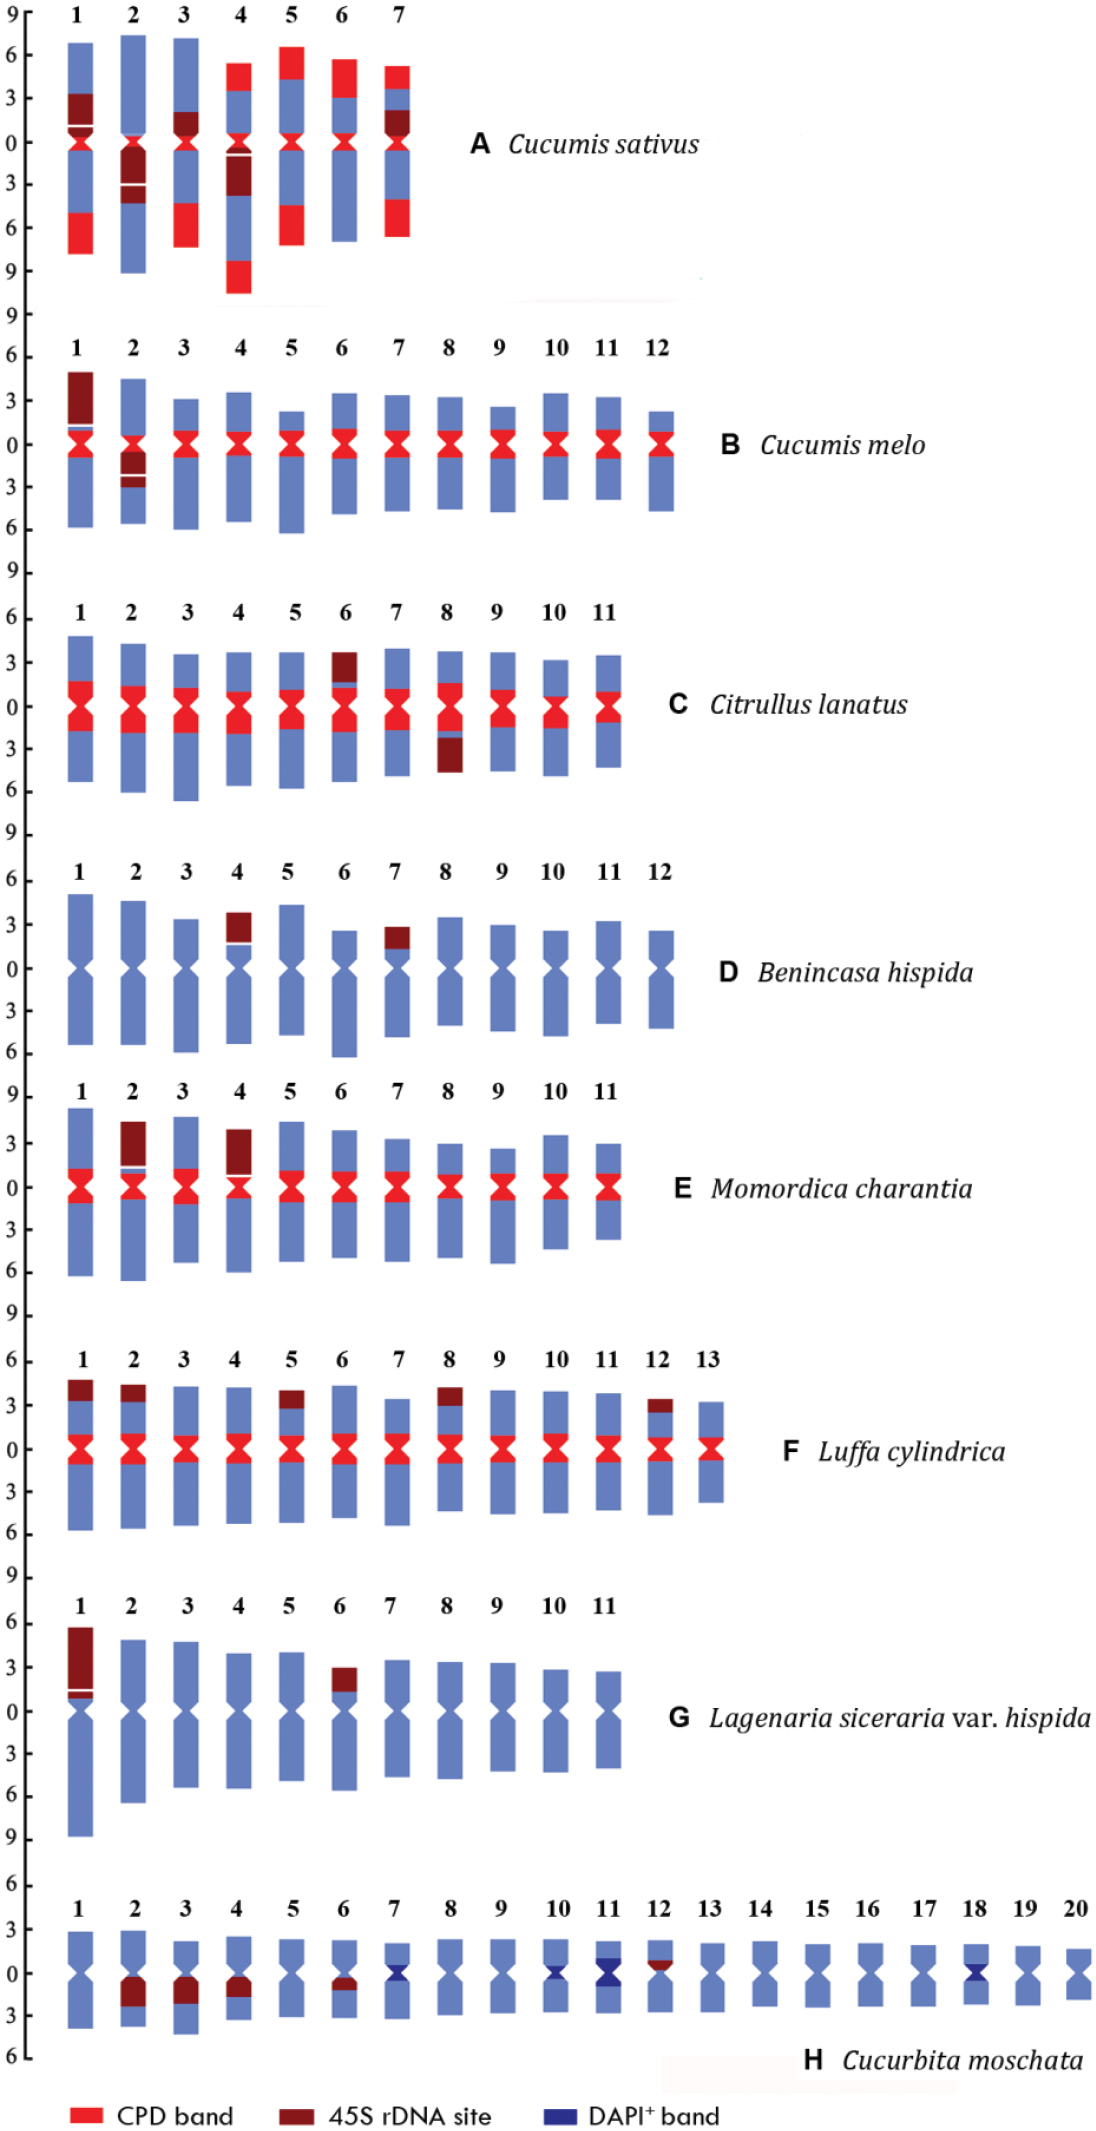
Idiograms of the eight species that display the chromosome measurements, and the position and size of the fluorochrome bands and 45S rDNA FISH signals. A, B, C, D, E, F, G and H indicate C. sativus, C. melo, C. lanatus, B. hispida, M. charantia, L. cylindrica, L. siceraria var. hispida and C. moschata, respectively. The ordinate scale on the left indicates the relative length of the chromosomes (i.e. % of haploid complement). The numbers at the top indicate the serial number of chromosomes. |