


(C) 2012 Gianni Bedini. This is an open access article distributed under the terms of the Creative Commons Attribution License 3.0 (CC-BY), which permits unrestricted use, distribution, and reproduction in any medium, provided the original author and source are credited.
For reference, use of the paginated PDF or printed version of this article is recommended.
The Italian endemic vascular flora is composed of 1, 286 specific and subspecific taxa. From the critical analysis of “Chrobase.it”, 711 of them (about 55%) have been studied from a karyological point of view. These taxa belong to 52 out of 56 families and 204 out of 284 genera. These data suggest that endemic species are more studied than the flora as a whole. Mean chromosome number for Italian endemics is 2n = 30.68 ± 20.27 (median: 2n = 26, mode: 2n = 18). These values are very close to those known for the whole flora. Similar variation ranges, among endemics and species with wider distribution, are likely to reflect similar evolutionary trends. Known chromosome numbers in Italian endemics range from 2n = 8 to 2n = 182. About 9% of taxa show more than one cytotype and the frequency of Bs in the Italian endemic vascular flora is 3.3%. These values are slightly smaller compared with the whole Italian flora. Finally, for the basic chromosome numbers x = 7, 8, 9, the proportion of diploids (2n = 2x) to even polyploids (2n = 4x, 6x, 8x and 10x) can be described by the exponential function f(p) = e(5.539 – 0.637p) (R2 = 0.984).
B-chromosomes, cytotaxonomy, endemics, evolution, Italy, polyploidy
The number of chromosome count databases, either hard-printed or online, matches current research trends, and attests to the usefulness of chromosome data in current taxonomic, genetic and cytogeographic research (
The Italian endemic vascular flora, according to on-going research carried out in collaboration with CRFA (Centro di Ricerca per la Flora dell’Appennino) of Barisciano (L’Aquila, Italy), comprises 1, 286 specific and subspecific taxa(L. Peruzzi, F. Bartolucci and F. Conti, unpublished data), including those species which eventually occur also in Corse (France). The present work aims to summarize the karyological knowledge focusing on the endemic component of Italian vascular flora, extracted from the online database “Chrobase.it” (
Data about chromosome numbers (n and/or 2n) and B-chromosomes about Italian vascular flora are stored in the online database “Chrobase.it” (
Concerning the list of endemics, for the difficult and critical genera Hieracium L. (1753) and Pilosella Vaill. (1754) (Asteraceae) the subspecies rank was not considered.
Analysis of dataMean (± standard deviation), median, modal chromosome number, and frequencies (histograms) were calculated for the entire dataset of Italian vascular flora endemics. Frequency and mean number (± standard deviation) of B-chromosomes for the whole dataset and for each genus were also calculated. The frequencies of basic chromosome numbers (x) in those complements (2n) where more than one basic number can occur were obtained by a taxon by taxon screening of relevant karyological literature quoted in Chrobase.it (
Chromosome counts are available for 711 out of the 1, 286 (ca. 55%) currently accepted specific and infraspecific endemic taxa, resulting in 839 different cytotypes; they are representative of 204 out of the 284 genera (72%) – and 52 out of the 56 families (91%) – encompassing the endemic taxa. The geographic distribution of counts is shown in Fig. 1. The most intensely investigated regions are Sicily, Tuscany and Sardinia, where more than half of the Italian endemic flora growing in the respective territories was karyologically studied. Table 1 shows the number of taxa studied for each region.
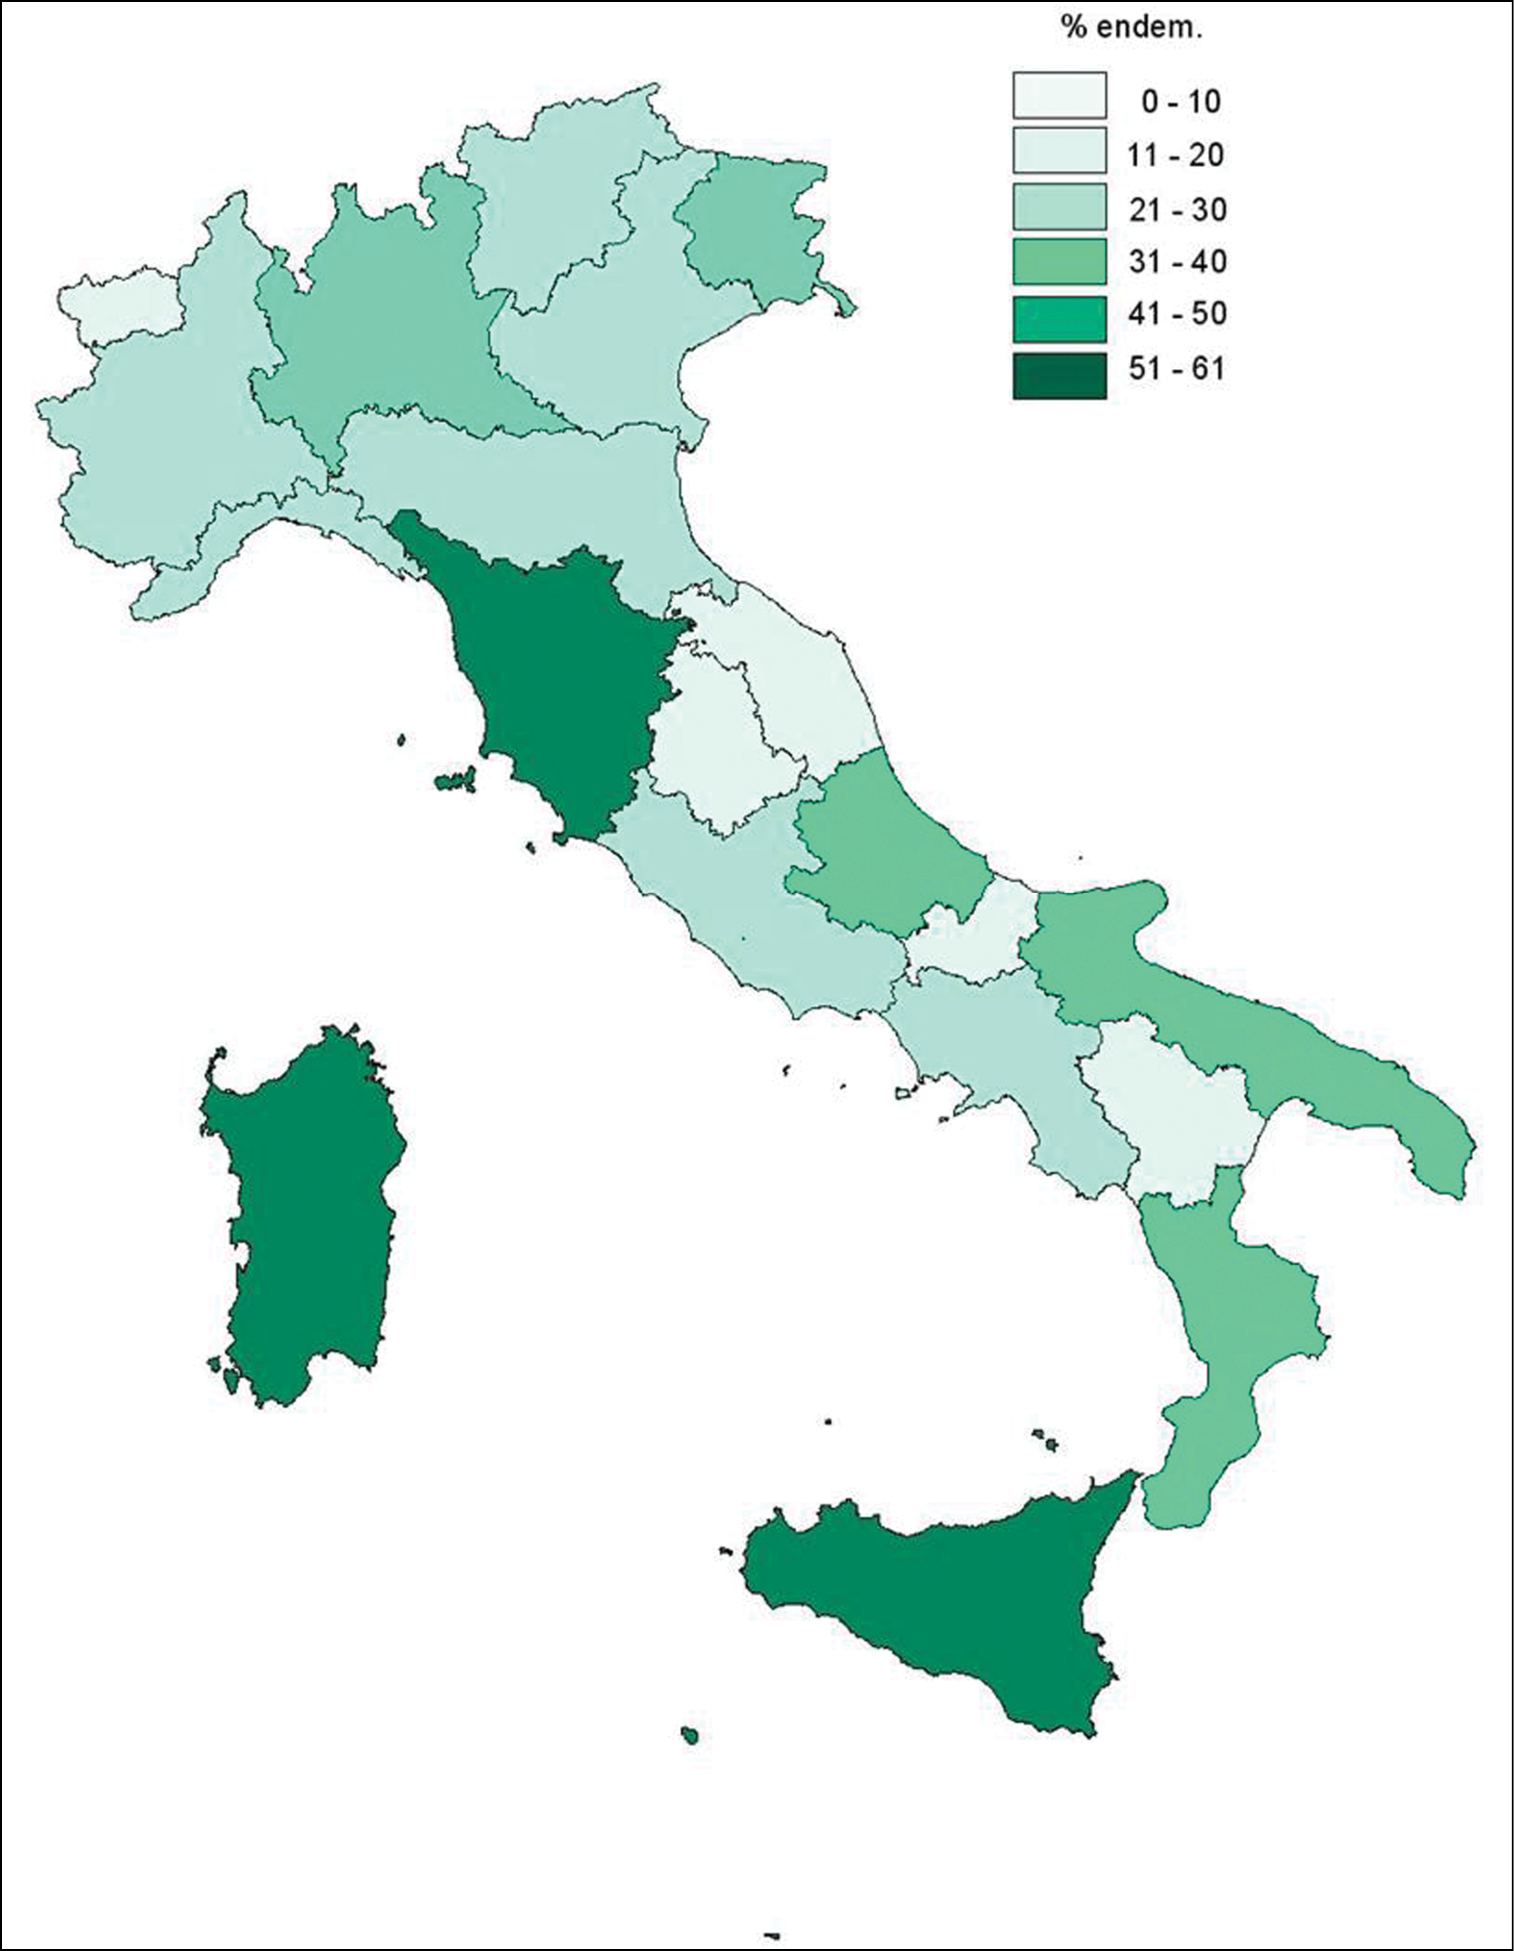
Map of Italian regions, showing the % endem. of Italian vascular flora karyologically studied with respect to the Italian endemics growing in each region (derived from
Number of karyologically studied Italian endemic vascular flora for each region. The sequence of regions is the same as the one used in
| Region | No. taxa studied |
|---|---|
| Valle d’Aosta | 0 |
| Piedmont | 7 |
| Lombardy | 13 |
| Trentino-Alto Adige | 9 |
| Veneto | 10 |
| Friuli-Venezia Giulia | 6 |
| Liguria | 9 |
| Emilia-Romagna | 9 |
| Tuscany | 89 |
| Marche | 10 |
| Umbria | 9 |
| Latium | 26 |
| Abruzzo | 61 |
| Molise | 2 |
| Campania | 26 |
| Apulia | 33 |
| Basilicata | 10 |
| Calabria | 75 |
| Sicily | 193 |
| Sardinia | 156 |
The distribution of the 711 taxa across families is shown in Fig. 2. The most represented families are Asteraceae (19%), Plumbaginaceae (14%), Fabaceae (8%), Brassicaceae and Caryophyllaceae (6%). For all the endemics from Rosaceae (26 taxa), Thymelaeaceae (2 taxa), Aspleniaceae, Berberidaceae, Cannabaceae, Convolvulaceae, Cucurbitaceae, Oleaceae, Papaveraceae and Pinaceae (1 taxon each), no karyological data is available in the literature.
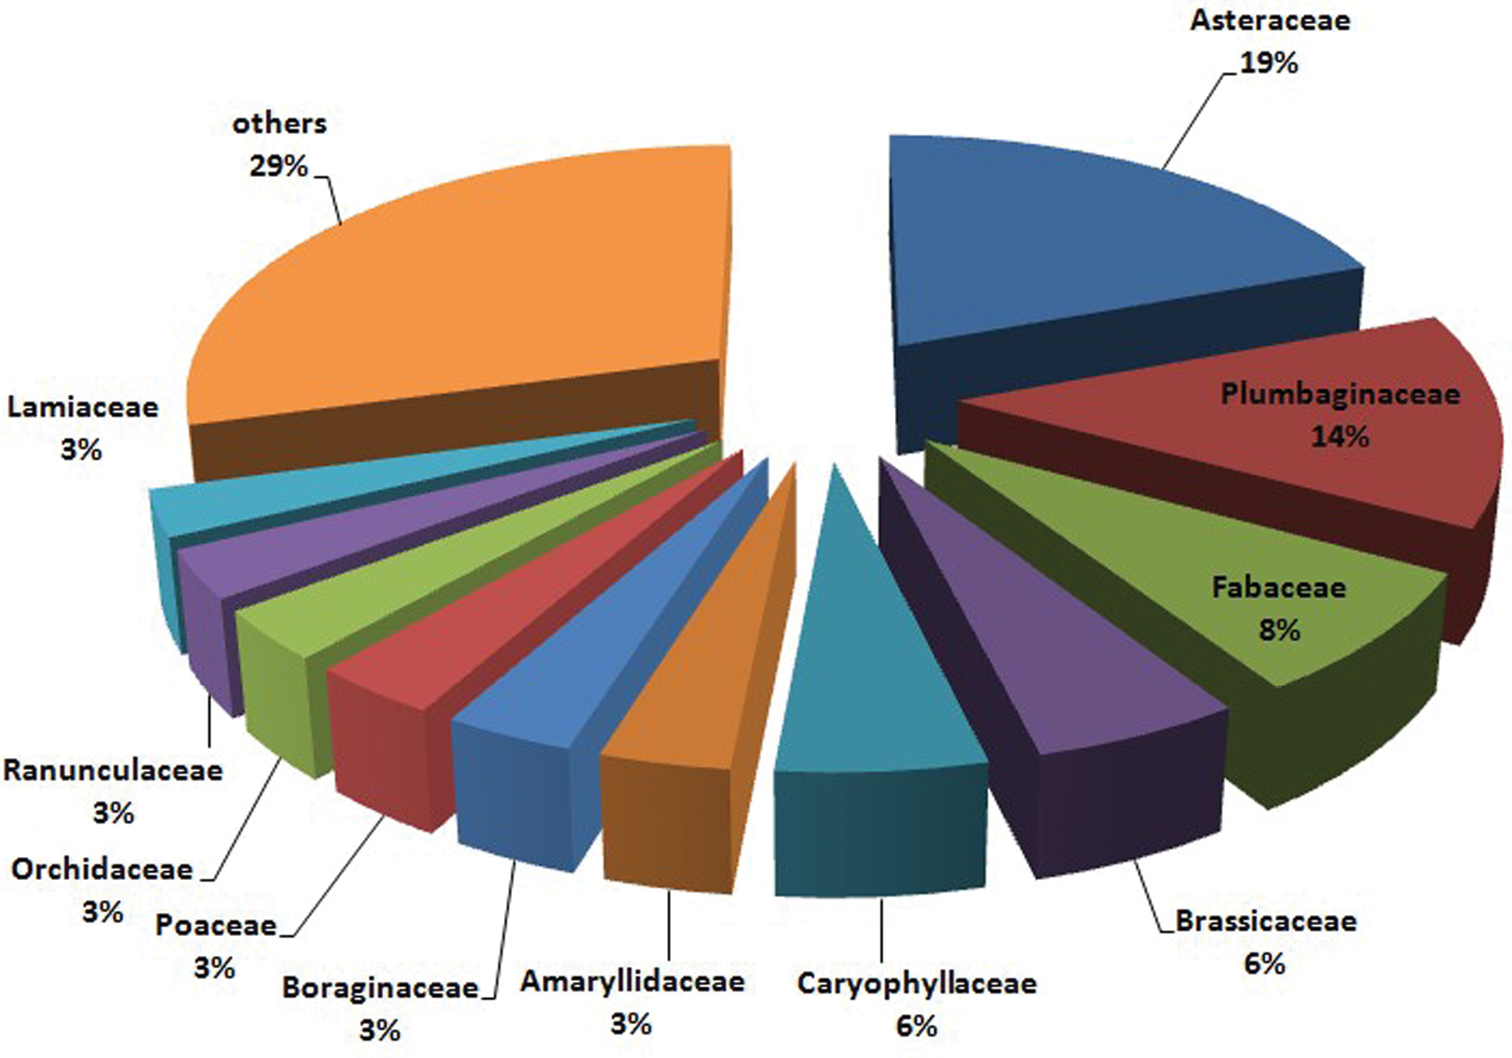
Pie plot showing the distribution of karyologically studied Italian endemic taxa across families. Families with less than 20 studied taxa were merged.
For 92 genera, of which 7 have ≥ 5 endemics, 100% of Italian endemics was covered (Table 2). Other 29 genera, hosting ≥ 5 endemics, showed coverage ranging from 93% in Genista L. (1753) to only 10% in Hieracium. The highest number of studied taxa occurs in the genera Limonium Mill. (1754) (84 taxa), Centaurea L. (1753) (46 taxa) and Genista (26 taxa).
Most karyologically studied genera of Italian endemics (≥ 5 taxa). They are arranged firstly according their decreasing % of coverage, secondly their number of taxa studied and, thirdly, alphabetically.
| Genus | No. taxa studied | Coverage |
|---|---|---|
| Anchusa L. (1753) | 7 | 100% |
| Ornithogalum L. (1753) | 7 | 100% |
| Crocus L. (1753) | 6 | 100% |
| Santolina L. (1753) | 6 | 100% |
| Sesleria Scop. (1760) | 6 | 100% |
| Stachys L. (1753) | 6 | 100% |
| Onosma L. (1762) | 5 | 100% |
| Genista L. (1753) | 26 | 93% |
| Allium L. (1753) | 18 | 90% |
| Viola L. (1753) | 17 | 85% |
| Limonium Mill. (1754) | 83 | 84% |
| Cardamine L. (1753) | 5 | 83% |
| Erysimum L. (1753) | 5 | 83% |
| Iris L. (1753) | 8 | 80% |
| Campanula L. (1753) | 14 | 77% |
| Biscutella L. (1753) | 10 | 77% |
| Anthemis L. (1753) | 8 | 75% |
| Pinguicula L. (1753) | 6 | 75% |
| Brassica L. (1753) | 8 | 73% |
| Cerastium L. (1753) | 8 | 73% |
| Euphorbia L. (1753) | 10 | 71% |
| Jacobaea Mill. (1754) | 5 | 71% |
| Armeria Willd. (1809) | 11 | 69% |
| Astragalus L. (1753) | 9 | 69% |
| Senecio L. (1753) | 6 | 67% |
| Centaurea L. (1753) | 45 | 66% |
| Helichrysum Mill. (1754) | 6 | 60% |
| Taraxacum F.W. Wigg. (1780) | 9 | 53% |
| Festuca L. (1753) | 8 | 53% |
| Asperula L. (1753) | 6 | 50% |
| Ranunculus L. (1753) | 16 | 48% |
| Saxifraga L. (1753) | 7 | 47% |
| Ophrys L. (1753) | 14 | 38% |
| Silene L. (1753) | 10 | 38% |
| Dianthus L. (1753) | 8 | 30% |
| Hieracium L. (1753) | 5 | 10% |
Genera with 100% karyological coverage but with less than 5 Italian endemics: Cynoglossum L. (1753) (4), Erodium L’Hér. (1789) (3), Gagea Salisb. (1806) (3), Plantago L. (1753) (3), Arenaria L. (1753) (2), Athamanta L. (1753) (2), Borago L. (1753) (2), Buphthalmum L. (1753) (2), Globularia L. (1753) (2), Hypericum L. (1753) (2), Isoëtes L. (1753) (2), Moltkia Lehm. (1817) (2), Muscari Mill. (1754) (2), Oncostema Raf. (1837) (2), Orchis L. (1753) (2), Paeonia L. (1753) (2), Ptilostemon Cass. (1816) (2), Pulmonaria L. (1753) (2), Rhaponticoides Vaill. (1754) (2), Ribes L. (1753) (2), Soldanella L. (1753) (2), Thapsia L. (1753) (2), Tragopogon L. (1753) (2), Veronica L. (1753) (2), Acer L. (1753) (1), Adonis L. (1753) (1), Adoxa L. (1753) (1), Ajuga L. (1753) (1), Anemonoides Mill. (1754) (1), Arum L. (1753) (1), Arundo L. (1753) (1), Bellium L. (1771) (1), Bituminaria Fabr. (1759) (1), Calendula L. (1753) (1), Callianthemum C.A. Mey. (1830) (1), Chiliadenus Cass. (1825) (1), Coristospermum Bertol, (1838) (1), Cryptotaenia DC. (1829) (1), Digitalis L. (1753) (1), Diplotaxis DC. (1821) (1), Drymochloa Holub (1984) (1), Echinops L. (1753) (1), Edraianthus (A. DC.) A. DC. (1839) (1), Erucastrum C. Presl (1826) (1), Ferula L. (1753) (1), Goniolimon Boiss. (1848) (1), Jasione L. (1753) (1), Jurinea Cass. (1821) (1), Klasea Cass. (1825) (1), Lactuca L. (1753) (1), Lagurus L. (1753) (1), Lamium L. (1753) (1), Lamyropsis (Kharadze) Dittrich (1971) (1), Leucojum L. (1753) (1), Limodorum Boehm. (1760) (1), Mentha L. (1753) (1), Morisia J. Gay (1832) (1), Nananthea DC. (1838) (1), Nepeta L. (1753) (1), Nigritella Rich. (1817) (1), Oenanthe L. (1753) (1), Oxytropis DC. (1802) (1), Petagnaea Caruel (1894) (1), Phleum L. (1753) (1), Pimpinella L. (1753) (1), Plagius DC. (1838) (1), Ptilotrichum C.A. Mey. (1831) (1), Prospero Salisb. (1866) (1), Pseudoscabiosa Davesa (1984) (1), Ptychotis W.D.J. Koch (1924) (1), Quercus L. (1753) (1), Retama Raf. (1838) (1), Rhizobotrya Tausch (1836) (1), Ruta L. (1753) (1), Salicornia L. (1753) (1), Sideritis L. (1753) (1), Solenanthus Ledeb. (1829) (1), Solidago L. (1753) (1), Symphytum L. (1753) (1), Teucrium L. (1753) (1), Trachelium L. (1753) (1), Tripolium Nees (1832) (1), Urtica L. (1753) (1), Vinca L. (1753) (1), Zelkova Spach (1841) (1).
Chromosome numbers range from 2n = 8, reported in 8 endemic taxa [Bellevalia dubia (Guss.) Schult. & Schult. f. (1830) s.s., Crepis vesicaria subsp. hyemalis (Biv.) Babc. (1941), Crocus etruscus Parl. (1860), Crocus ilvensis Peruzzi & Carta (2011), Crocus siculus Tineo (1832), Hypochaeris robertia (Sch. Bip.) Fiori (1910), Leontodon anomalus Ball (1850) and Leontodon intermedius Porta (1879)], to 2n = 180, 182, reported for Colchicum gonarei Camarda (1978).
The mean chromosome number is 2n = 30.68 ± 20.27, with median 2n = 26 and mode 2n = 18. Fig. 3 shows the most frequent chromosome numbers in the whole dataset of the Italian endemics. The six most frequent chromosome numbers are 2n = 14, 2n = 16, 2n = 18, 2n = 27, 2n = 32 and 2n = 36. Taken together, they account for more than one half (51%) of all the counts available.
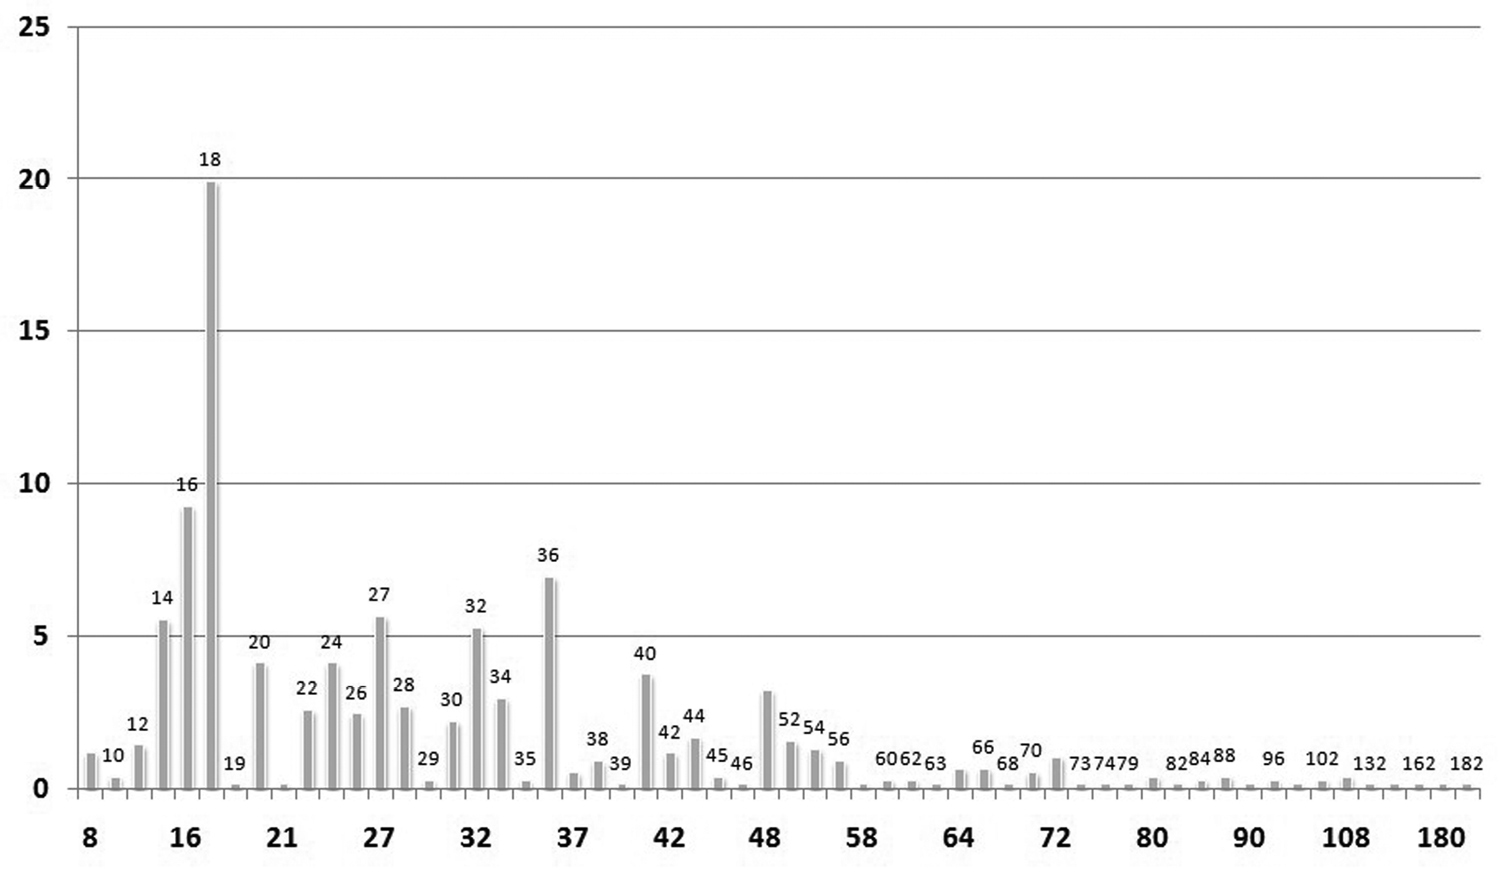
Histograms showing the percentage frequencies (y-axis) of 2n chromosome numbers (x-axis) known for the Italian endemic vascular flora.
Concerning chromosome complements where more than one basic number can occur, the most heterogeneous, among those up to 2n= 72 (Table 3), are: 2n = 24, which in most cases represents diploids with x = 12, but also triploids with x = 8 and rarely tetraploids with x = 6; 2n = 36, which in most cases represents tetraploids with x = 9, then diploids with x = 18 and rarely triploids with x = 12; 2n = 40, with tetraploids, pentaploids and diploids; 2n = 48, representing mostly by diploids with x = 24, but also tetraploids with x = 12 and hexaploids with x = 8; 2n = 56, representing mostly tetraploids with x = 14, but also diploids with x = 28 and octoploids with x = 7. The most frequent chromosome numbers, not reported in Table 3, include only diploids (2n = 2x = 14, 2n = 2x = 18) or triploids (2n = 3x = 27). When we apply these observations to the six most frequent chromosome numbers 2n = 14, 2n = 16 and 2n = 18, 2n = 27, 2n = 32 and 2n = 36, pooled together, we obtain 73.1% diploids, 15.9% tetraploids and 11% triploids.
Chromosome complements up to 2n = 72, where more than one basic number (x) can occur, and respective x frequencies. The frequencies were obtained by a taxon-per-taxon literature screening. Higher chromosome numbers (very rare, in our dataset) were not considered.
| 2n | Basic chromosome numbers (x) | ||||||||||||
|---|---|---|---|---|---|---|---|---|---|---|---|---|---|
| 4 | 5 | 6 | 7 | 8 | 9 | 10 | 12 | 14 | 16 | 18 | 20 | 21 | |
| 8 | 100% | ||||||||||||
| 12 | 100% | ||||||||||||
| 16 | 2.8% | 97.2% | |||||||||||
| 20 | 3.1% | 96.9% | |||||||||||
| 24 | 4.2% | 20.8% | 71% | ||||||||||
| 28 | 51% | 49% | |||||||||||
| 32 | 71.9% | 28.1% | |||||||||||
| 36 | 62.8% | 2.3% | 34.9% | ||||||||||
| 40 | 20.7% | 62% | 17.3% | ||||||||||
| 42 | 22% | 11% | 67% | ||||||||||
| 6 | 7 | 8 | 9 | 11 | 12 | 13 | 14 | 18 | 22 | 28 | 32 | ||
| 44 | 92.3% | 7.7% | |||||||||||
| 48 | 12% | 88% | |||||||||||
| 54 | 90% | 10% | |||||||||||
| 56 | 25% | 12.5% | 37.5% | 25% | |||||||||
| 64 | 80% | 20% | |||||||||||
| 70 | 75% | 25% | |||||||||||
| 72 | 12.5% | 87.% | |||||||||||
The relationships among the different even ploidy levels, within each considered basic chromosome number (x = 7, x = 8, x = 9), was best described by an exponential function (Table 4). The power function provided the second-best fit, with a slightly higher RSS, followed by the logarithmic and linear functions, whose RSS is higher by an order of magnitude. Hence, diploids are much more frequent than polyploids, and frequency gradually decreases with increasing levels of polyploidy (Fig. 4).
Goodness of fit of different models. The coefficients (a, b) matching the least-squares estimates are given for each model. RSS = Residual Sum of Squares. **= significant at 0.01 level.
| formula | coef. a | coef. b | RSS | R-squared |
|---|---|---|---|---|
| y = a*x + b | 7.786 | 66.714 | 3353.531 | 0.6844** |
| y = a*x^b | 297.600 | 2.060 | 235.400 | 0.9780** |
| y = a + b*log(x) | 91.940 | -43.580 | 1422.000 | 0.8660** |
| y = e^(a + b*x) | 5.539 | -0.637 | 170.400 | 0.9840** |
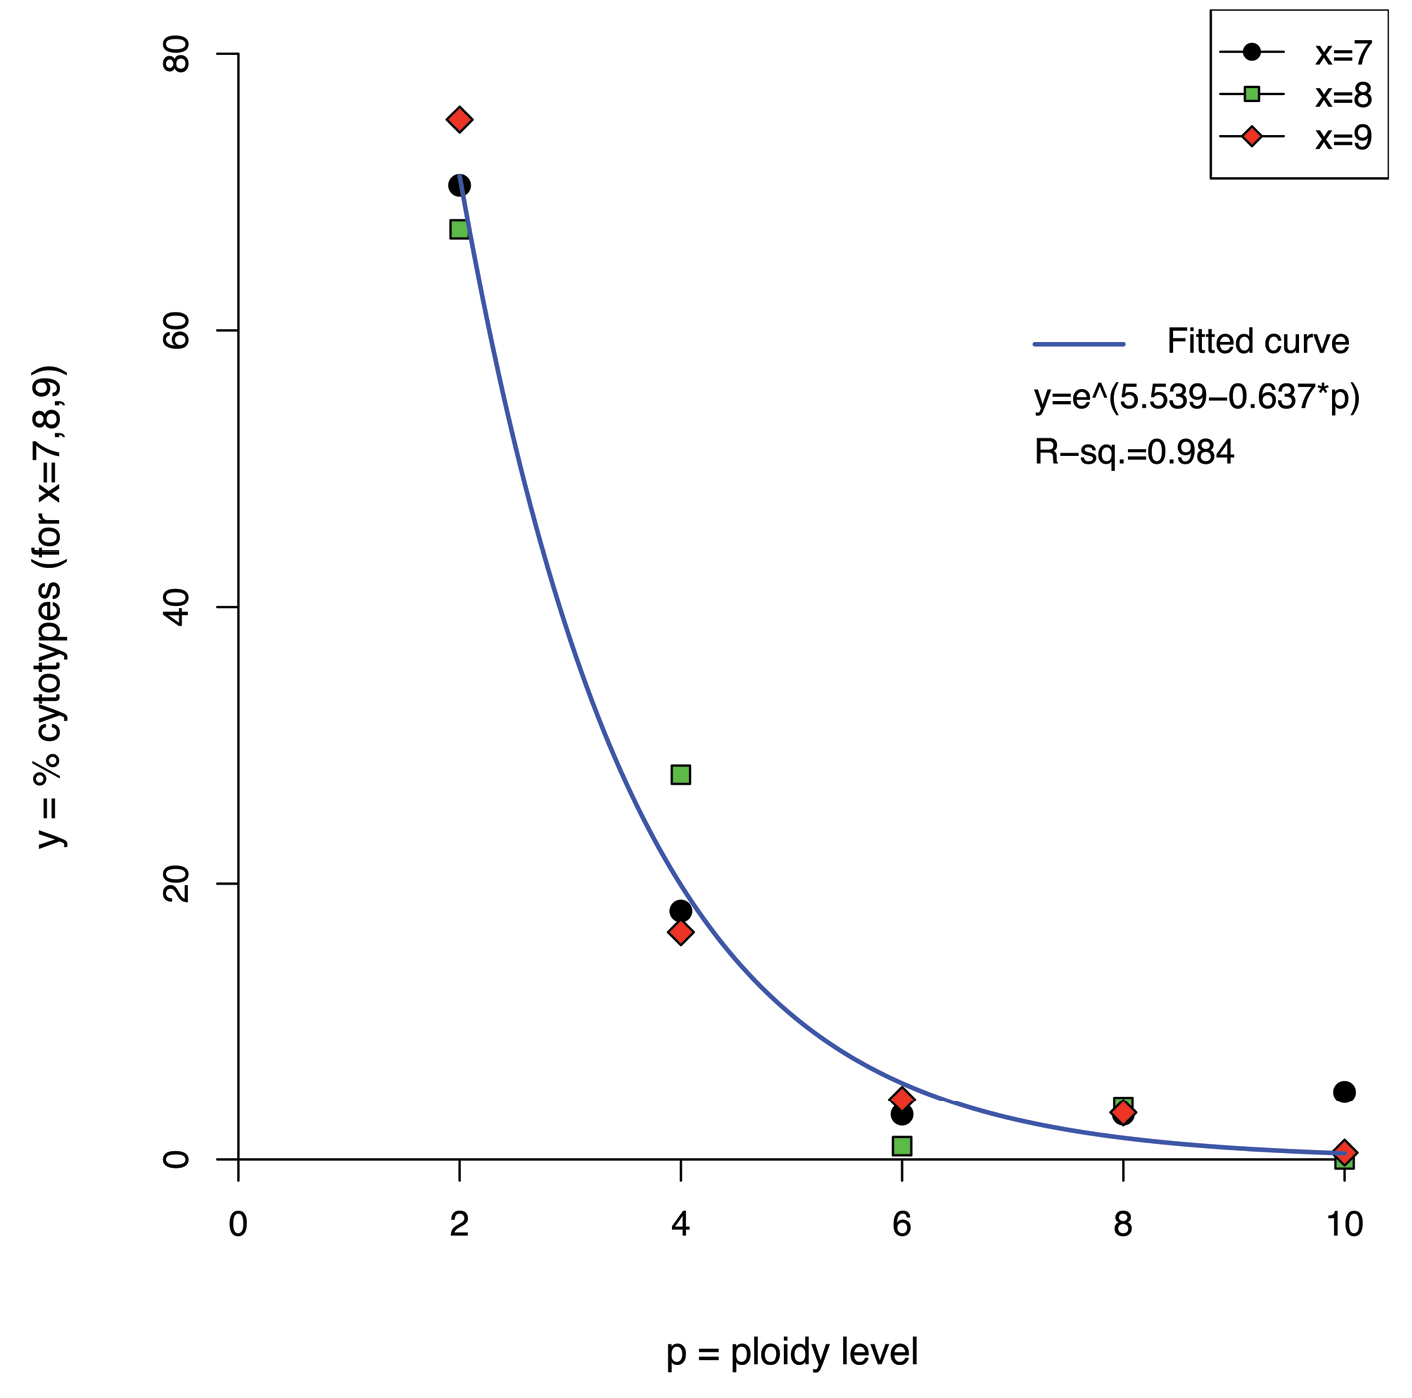
Plot showing the percentage frequencies (y-axis) of even ploidy levels from 2x to 10x (p-axis), for three frequent basic chromosome numbers (x = 7, x = 8 and x = 9) and the curve fitted to the data points by nonlinear least-square estimate.
More than one cytotype was shown by 65 out of 711 taxa, with a maximum number of seven in Crocus minimus DC. (1804) (2n = 24, 25, 26, 27, 28, 29, 30); six in Ornithogalum etruscum Parl. (1857) subsp. etruscum (Asparagaceae): 2n = 72, 73, 74, 79, 90, 108 and in Genista sulcitana Vals. (1986) (Fabaceae): 2n = 18 + 0–2B, 27 + 0–2B; in 12 taxa, the variation is due to the possible presence of B-chromosomes.
B-chromosomes occur in 16/711 taxa and in 24 cytotypes (3.3% of the dataset), grouped in 10/284 genera (3.5%), 9/56 families (16%). Among the taxa showing B-chromosomes, their mean number is 1.73 ± 0.91, mode = 1 and median = 1.5. The highest number of B-chromosomes is 4, from a single accession of Agrostis monteluccii (Selvi) Banfi (2005) (Poaceae) and a single accession of Rhinanthus wettsteinii (Sterneck) Soó (1929) (Orobanchaceae). Table 5 shows the families and genera involved, with respective number of taxa showing B-chromosomes. Many records are concentrated in the genus Genista.
Families and genera showing B-chromosomes in Italian vascular flora endemics, with the respective number of taxa (cytotypes), and the range of Bs.
| Family | Genus | No. cytotypes with B | range of Bs |
|---|---|---|---|
| Fabaceae | Genista L. (1753) (5 taxa) | 10 | 1–2 |
| Poaceae | Agrostis L. (1753) | 4 | 1–4 |
| Asparagaceae | Ornithogalum L. (1753) | 2 | 1, 3 |
| Boraginaceae | Onosma L. (1762) | 2 | 1 |
| Boraginaceae | Pulmonaria L. (1753) | 1 | 2 |
| Lamiaceae | Scutellaria L. (1753) | 1 | 2 |
| Orchidaceae | Orchis L. (1753) | 1 | 1 |
| Orobanchaceae | Rhinanthus L. (1753) | 1 | 4 |
| Primulaceae | Primula L. (1753) | 1 | 1 |
| Ranunculaceae | Ranunculus L. (1753) | 1 | 1 |
The taxonomic and geographic distribution of karyological knowledge in Italian endemics closely parallels that dealing with the whole Italian vascular flora (
The precise relationship [exponential function f(p) = e(5.539 – 0.637p) (R2 = 0.984)] found among even ploidy levels from 2x to 10x within the frequent basic chromosome numbers x = 7, x = 8 and x = 9 was never reported before in literature, as far as we are aware (see also
Odd ploidy levels are generally very rare in our dataset, with the noteworthy exception of triploids with 2n = 27. As already evidenced by
The meaning of the precise relationship found in this work must be clarified by further analyses on large datasets of chromosome counts (e.g. PhytoKaryon;
Despite the efforts of Italian and foreign botanists in studying the endemic flora, the data here highlighted clearly show how much work is still to be done, concerning the karyological knowledge of Italian endemics. However, we were able to summarize the up-to-date knowledge, which accounts for more than one half of the endemic flora, and to suggest that these species likely followed karyological evolutionary processes similar to the whole flora. Moreover, as far as we are aware, it is the first time that a precise quantitative relationship between (even) ploidy levels is shown to occur. We demonstrated indeed that, for the frequent basic chromosome numbers x = 7, x = 8 and x = 9 the diploids dominate and are related to higher even ploidy levels by an exponential relationship. In our mind, this intriguing phenomenon opens a new line of investigation in cytogenetics, aimed to clarify the evolutionary mechanisms giving rise to these constant relationships among increasing even ploidy levels.
Financial funding (EX60%) from University of Pisa is gratefully acknowledged.