CompCytogen 6(3): 273–286, doi: 10.3897/CompCytogen.v6i3.3380
Physical mapping of 5S and 18S-5.8S-26S RNA gene families in polyploid series of Cenchrus ciliaris Linnaeus,  1771 (Poaceae)
Amina Kharrat-Souissi 1, Sonja Siljak-Yakovlev 2, Fatima Pustahija 2,3, Mohamed Chaieb 1
1 Faculté des Sciences de Sfax, U.R. Diversité végétale & Ecosystèmes en Milieu Aride, B.P. 1171, 3000, Sfax, Tunisie
2 Univ. Paris-Sud, Ecologie, Systématique, Evolution, UMR 8079 CNRS- AgroParisTech-UPS, Université Paris-Sud, Bâtiment 360, 91405 Orsay Cedex, France
3 Faculty of Forestry, University of Sarajevo, Zagrebacka 20, 71000 Sarajevo, Bosnia and Herzegovina

Corresponding author: A. Kharrat-Souissi (kharratsouissi@yahoo.fr)

Academic editor: Julio R. Daviña

received 12 May 2012 | accepted 10 July 2012 | Published 20 August 2012


(C) 2012 Amina Kharrat-Souissi. This is an open access article distributed under the terms of the Creative Commons Attribution License 3.0 (CC-BY), which permits unrestricted use, distribution, and reproduction in any medium, provided the original author and source are credited.


For reference, use of the paginated PDF or printed version of this article is recommended.

Abstract

The Buffelgrass (Cenchrus ciliaris L., Poaceae) is one of the most important pasturage grasses due to its high productivity and good forage qualities. This species possess a high adaptability to bioclimatic constraints of arid zones and may be used for the restoration of degraded arid ecosystems. Tunisian populations present three ploidy levels (4x, 5x and 6x) with a basic chromosome number x=9. This study reported for the first time the distribution of the ribosomal genes (rRNA) for pentaploid and hexaploid cytotypes of Cenchrus ciliaris. Molecular cytogenetic study using double fluorescence in situ hybridization has shown that the two rDNA families, 5S and 18S-5.8S-26S (18S), displayed intraspecific variation in number of loci among different ploidy levels. Each ploidy level was characterized by specific number of both 5S and 18S rDNA loci (two loci in tetraploid, five in pentaploid and six in hexaploid level). For three studied cytotypes (4x, 5x and 6x) all 5S rDNA loci were localized on the subcentromeric region of chromosomes, while 18S loci were situated on the telomeric region of short chromosome arms. Data of the FISH experiments show proportional increase of ribosomal loci number during polyploidization processes.

Keywords

Buffelgrass, Cenchrus ciliaris, fluorescence in situ hybridization , fluorochrome banding, polyploidy, rDNA organization

Introduction

In the south of Tunisia, the ecosystems are characterized by a high level of anthropogenic disturbance and have been characterized by several factors such as climatic variations and overgrazing (Le Houérou and Hoste 1977). These ecosystems are subjected to high aridity, decrease of biological productivity (Floret et al. 1981), where the perennial species are most affected (Jauffret and Lavorel 2003). Thanks to its high productivity, good forage qualities, fast growth and spreading (Stieber and Wipff 2003) Cenchrus ciliaris (syn. Pennisetum ciliare (L.) Link) is one of the most promising grass species for rehabilitation of arid rangelands and erosion control in Tunisia and other arid and semi-arid regions. This species occurs widely in tropical, subtropical and warm temperate regions (Watson and Dallwitz 1992), where it represents the species with high pastoral value (Le Houérou and Ionesco 1973). Cenchrus ciliaris is especially important in the semi-arid regions because of its high tolerance and adaptability to hot and dry environments (Hall 2001), and its resistance to cutting (Chaieb et al. 1996). This species is highly polymorphic and variable for several morphological traits of ecological and agronomic importance (Mseddi et al. 2004). The embryological and karyological studies of Cenchrus ciliaris have shown the aposporous mode of reproduction followed by pseudogamy (Ozias-Akins et al. 2003).

Most flowering plants are polyploids, since polyploidization is a ubiquitous event in plant evolution (Wendel 2000). The widespread occurrence of a polyploidy has been attributed to the potential of polyploid species to adapt to a wide range of habitats and survive better in unstable climates than their diploid progenitors (Heslop-Harrison 2000). Cenchrus ciliaris posses three ploidy levels: tetraploid (2n=4x=36), pentaploid (2n=5x=45) and hexaploid (2n=6x=54) (Fisher et al. 1954). Most of natural populations around geographical range of species are tetraploid (Fisher et al. 1954). Recently, in the natural Tunisian populations, all three ploidy levels have been discovered (Kharrat-Souissi et al. in press). Namely, in the panel of Tunisian investigated material, most populations are hexaploid, few of them are pentaploid, and one is tetraploid. The genome size of natural populations of Cenchrus ciliaris was previously determined by Kharrat-Souissi et al. (in press). It ranged from 2C=3.04 to 4.61 pg, revealing three ploidy levels corresponding to 4x, 5x, 6x, with mean 2C DNA amount of 3.04, 3.77 and 4.48 pg respectively. However the only previous data concerning DNA content of Cenchrus ciliaris are those of Burson et al. (2002). They analysed the genome size on material resulting from experimental progeny of six Cenchrus ciliaris populations (tetraploid and pentaploid) which were self-pollinated or/and cross-pollinated with Cenchrus setigerus.

The cytogenetic information provided by combination of chromosome banding and fluorescence in situ hybridization (FISH) can be useful for comparing the populations of the same species (Muratović et al. 2005), species within the same genus (Siljak-Yakovlev et al. 2003, Bogunic et al. 2006, Cabral et al. 2006), as well as species of different genera (Fregonezi et al. 2004). This technique was used for physical mapping of genes, karyotyping and analysis of genome organization (De Jong 2003, Jiang and Gill 2006). In this study the FISH was used in population study of Cenchrus ciliaris from different geographic origins (from the north to the south of Tunisia).

The objective of the current study was to elucidate the possible changes in number and location of rDNA sites through different ploidy levels of Cenchrus ciliaris by physical mapping of 5S and 18S rRNA genes.

Material and methods Plant material and chromosome preparation

The geographical origins of Cenchrus ciliaris samples collected in natural populations in Tunisia are given in Table 1 and Fig. 1. The vouchers were deposited at the herbarium of the Laboratory of Plants Diversity and Ecosystems in Arid Areas, Department of Biology, University of Sfax. The seedlings were germinated on moist filter papers in Petri dishes at 28°C. After three days, the root tip meristems were removed from germinated seedlings and treated with 2 mM 8-hydroxyquinoline solution for 3 h at 16°C. Subsequently, the material was fixed in freshly prepared ethanol: acetic acid (3:1, v/v) solution.

Table 1.

Geographical origin, genome size, ploidy level, number of 5S and 18S rDNA loci in Tunisian populations of Cenchrus ciliaris. Data from Kharrat-Souissi et al. (in press); SD, standard deviation.

Localities Population Code Latitude Longitude 2C DNA in pg 2n Ploidy level (x) Number of 5S rDNA signals Number of 18S rDNA signals
South of Tunisia city MR01 36°73'N, 10°24'E 3.03 ±0.03SD 36 4 4 4
East of Teboulta SA02 35°56'N, 11°06'E 4.56±0.01 54 6 6 6
Meknassi Pist ME04 34°32'N, 10°06'E 3.74±0.09 45 5 5 5
Haddej Pist I ME06 34°26'N, 09°12'E 4.34±0.06 54 6 6 6
Haddej pist II ME08 34°24'N, 09°29'E 3.63±0.03 45 5 5 5
Gabès ME09 34°10'N, 09°59'E 4.55±0.03 54 6 6 6
El Hamma - Menzel Habib ME10 34°02'N, 09°44'E 4.46±0.09 54 6 6 6
Gabès- 45 Km – Medenin JF12 33°37'N, 10°28'E 4.57±0.05 54 6 6 6
Metameur-18Km- Toujane JF14 33°24'N, 10°16'E 4.49±0.11 54 6 6 6
IRA of Ben Guerdane-35 km-sidi Mahdi ST24 32°49'N, 11°20'E 4.47±0.04 54 6 6 6
National park of Sidi Toui (Est) ST25 32°43'N, 11°14'E 4.48±0.04 54 6 6 6
IRA of Ben Guerdane - 50 km - Sidi Mahdi ST26 32°42'N, 11°18'E 4.30±0.08 54 6 6 6
Remada-Dhibat (oued el Anguar) DH28 32°08'N, 10°32'E 4.34±0.04 54 6 6 6
Figure 1.

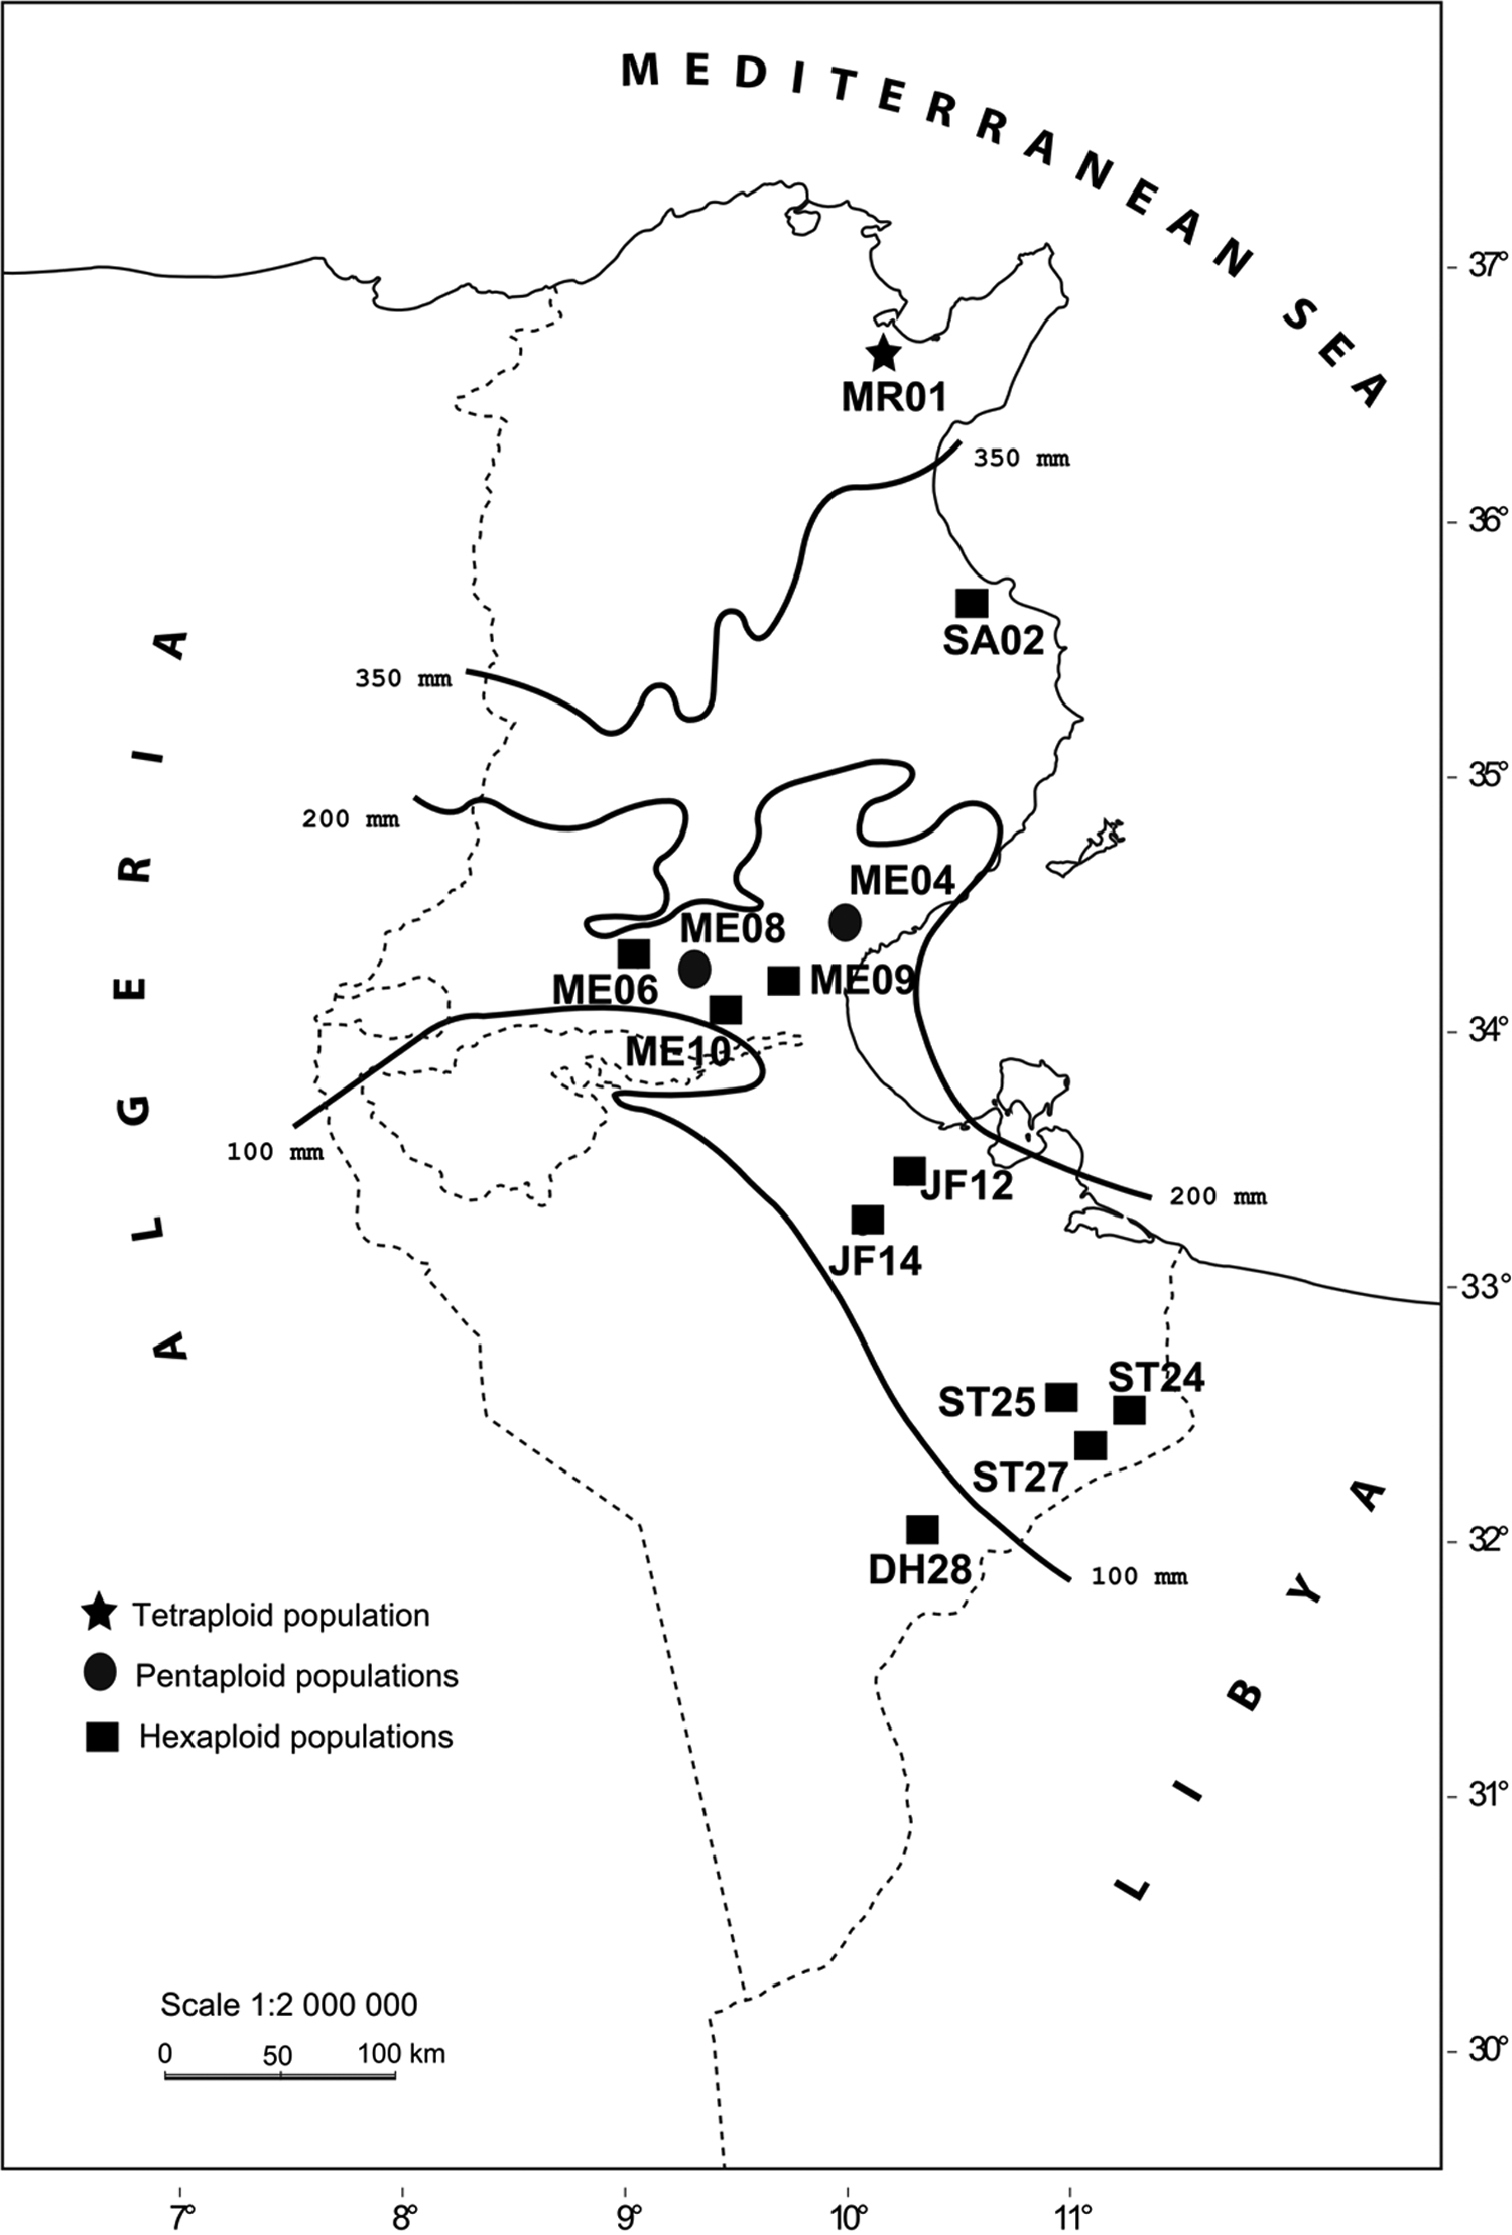
Geographical origin of 13 populations of Cenchrus ciliaris in Tunisia.

A slightly modified air drying technique (Geber and Schweizer 1987) was used for chromosome preparations. Five root tips were washed in 0.01M citrate buffer (pH 4.6) for 10 min, and removed to the enzyme mixture (4% R-10 cellulase /Yakult Honsha Co. Tokyo, Japan/, 1% pectolyase Y-23 /Seishin Co., Tokyo, Japan/, 4% hemicellulase /Sigma, France/) for approximately 25 min at 37°C, depending on the root size. Macerated meristems were washed with the same buffer and centrifuged 2 times (4.000 rpm, 5 min), and then the cells suspension was fixed in ethanol:acetic acid solution (3:1, v/v) and centrifuged. The final pellet was resuspended in 50 μl of the same fixative solution. Protoplasts were dropped on a clean slide and kept at room temperature for drying.

Fluorochrome banding

GC-rich heterochromatin staining with chromomycin A3 (CMA3, Sigma Aldrich Co., Steinheim, Germany) was performed following Schweizer (1976) with minor modification as described by Siljak-Yakovlev et al. (2002). After incubation in McIlvain buffer pH 7 (with 5 mM MgSO4, ) during 15 min and staining with CMA3 (0.2 mg/ml in same buffer) for 7, 30 or 90 min in dark, the slides were rinsed in the same buffer and counterstained with methyl green (0.5 % in McIlvain buffer pH 5.5) for 7 min and finally were rinsed in McIlvaine buffer pH 5.5. The slides were mounted in the Citifluor, AF1 anti-fade agent (Agar Scientific, Stansted Essex, UK).

Fluorescence in situ hybridization (FISH)

The FISH experiment was carried out with two different specific probes of ribosomal DNA (rDNA) simultaneously according to the protocol of Heslop-Harrison et al. (1991). One of the probes is a clone of 4 kb EcoRI fragment, including 18S-5.8S-26S rDNA from Arabidopsis thaliana Linnaeus Heynh., 1842 labeled with direct Cy3 (Amersham, Saclay, France). The second probe was the pTa 794 clone containing 410 bp BamHI fragment of the 5S rDNA from wheat labeled with Digoxigenin-11-dUTP (Roche Diagnostics, Meylan, France). Slides were counterstained and mounted in Vectashield medium containing DAPI (4, 6-diamidino-2-phenylindole, Vector laboratories, Peterborough, UK) and observed with an epifluorescence Zeiss Axiophot microscope (filter sets 01, 07, 15 and triple 25). The acquisition and treatment of images were performed using a highly sensitive CCD camera (RETIGA 2000R, Princeton Instruments, Evry, France) and an image analyzer (MetaVue, Evry, France). The FISH experiments were carried out for several individuals from one tetraploid population, two pentaploid populations and ten hexpaloid populations.

Karyological analyses

At least five metaphasic chromosome plates were used for karyometrical analysis and construction of idiogram. Chromosomes were classified according to their size and shape related to the centromere position. Terminology used for centromere position follows that of Levan et al. (1964). The total chromosome length for each pair was calculated as the sum of the short and the long arm. Determination of centromere position centromeric index [i%=(short arm/long+short arms)×100] and chromosome type arm ratio (r=long arm/short arm) were performed following nomenclature of Levan et al. (1964).

Results Distribution of GC rich DNA and constitutive heterochromatin

The chromosomes of Cenchrus ciliaris stained with CMA3generally showed the pale fluorescent bands of GC rich DNA detected with difficultyafter 90 min of staining, and not easily visible on microphotographs (Fig. 2A–B–C). These GC richbands were occasionally well visible only in hexaploids, where the maximum of three to four signals colocalized with 18S rDNA loci were observed (Fig. 2D). The chromomycin A3 positive signals were also observed in the interphase nuclei (Fig. 2E) which demonstrated the heterochromatin nature of this GC rich DNA. The clear centromeric DAPI+ bands, corresponding to constitutive heterochromatin, were observed after FISH experiments, but only for tetraploid population (Fig. 2A’–F).

Figure 2.

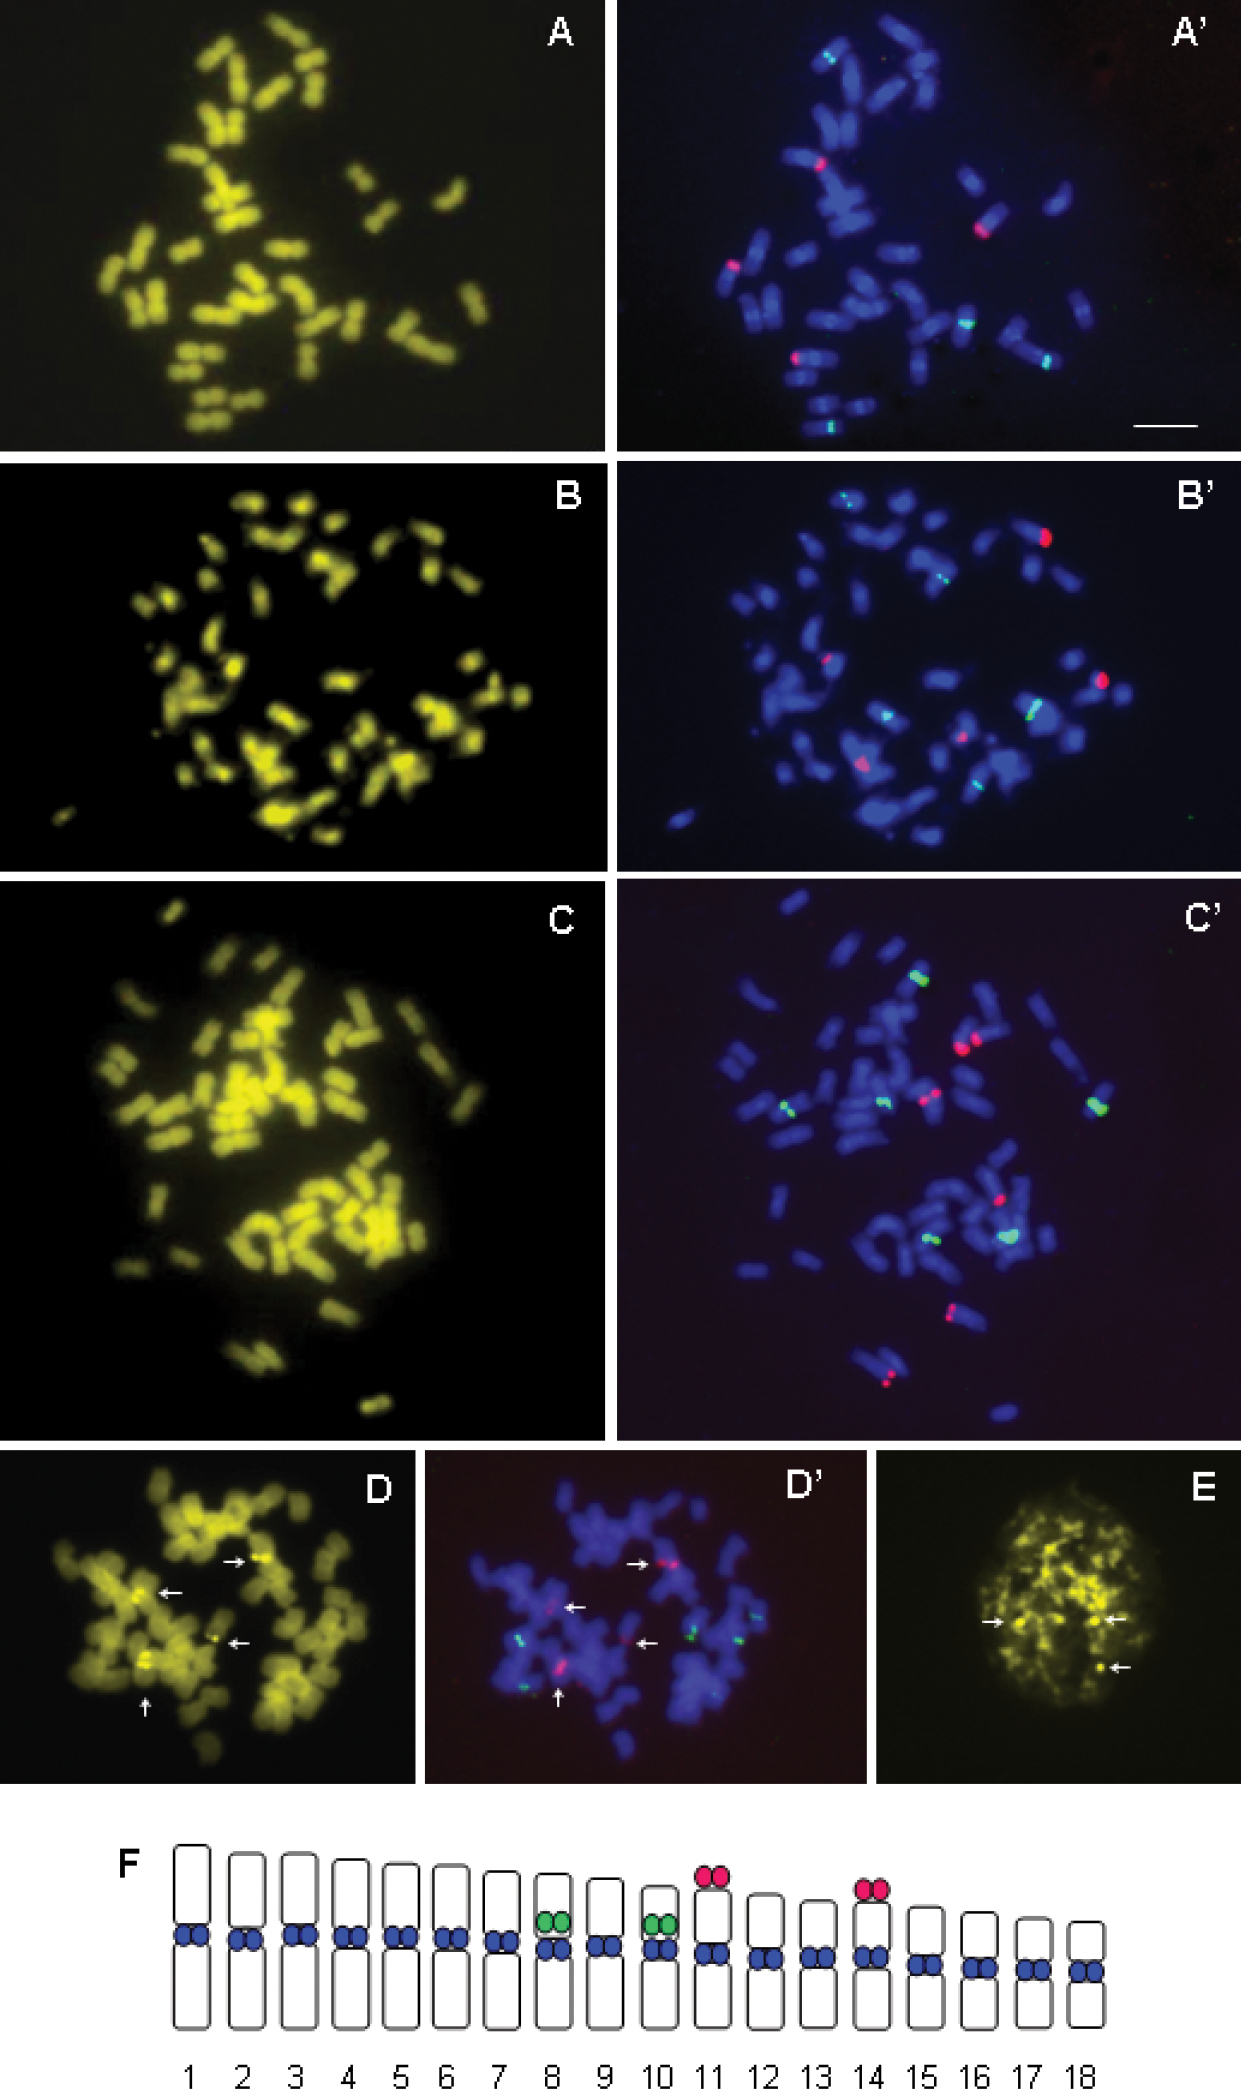
A–F Chromomycin banding and fluorescence in situ hybridization of 5S rDNA (green) and 18S rDNA (red) probes respectively on the same chromosome plate: tetraploid individuals (A, A’); pentaploid individuals (B, B’) and hexaploid individuals (C, C’); CMA+ signals (D) correspond to 18S rDNA loci (D’) in hexaploid individuals; CMA+ signals in interphase nuclei (E); Idiogram of tetraploid individuals, with location of 5S (green), 18S (red) and DAPI (blue) signals (F). Bar = 10µm.

Physical mapping of ribosomal genes

The results of 5S and 18S ribosomal genes mapping in Cenchrus ciliaris showed that tetraploid population exhibited four signals for both rRNA gene families (Fig. 2A’). In two studied pentaploid populations from different geographical origins (Table 1), five signals of both 5S and 18S rDNA were observed (Fig. 2B’), while six signals were detected in hexaploid populations (Fig. 2C’). It was observed that number of 5S and 18S rDNA loci increased, as expected, with ploidy level (Fig. 2): tetraploid individuals possessed four, pentaploids five, and hexaploids six loci. The 18S rDNA loci had terminal, while 5S rDNA presented pericentromeric localization (Fig. 2). The signals of 5S and 18S rDNA slightly vary in size and intensity, which was probably related to variation in number of copies. The results of CMA staining and FISH experiment on the same metaphase plate show that the GC rich regions, when they are detected as strong bands, correspond to the FISH signals of 18S rDNA probe (Fig. 2D–D’).

Chromosome identification and construction of idiogram

Because many of the chromosomes are similar in size and morphology, chromosome identification for karyotype analysis is very difficult for Cenchrus ciliaris. Thus, in present study we constructed the idiogram (Fig. 2F) for tetraploids based on conventional morphometry (Table 2) and determined the number and position of rRNA gene loci. The average chromosome length varied from 1.82 to 3.43 µm. The value of R (ratio between the longest and shortest chromosome pair, according to Stebbins 1971) was 0.9, and asymmetry index was 47.89 %. The similarity in chromosome size, difficulties in determining the centromere position and identification of homologous chromosomes makes idiogram construction for pentaploids and hexaploids too difficult.

Table 2.

Morphometric data concerning the karyotype of tetraploid Cenchrus ciliaris individuals. R = 0.9; AsI % = 47.89; s, short arm; l, long arm; c, total chromosome length; l/s, ratio of long and short arms; i, centromeric index = 100 x s/(l+s); m, metacentric chromosome type (according to Levan et al. 1964); R = the ratio of the longest to the shortest chromosome pair (according to Stebbins 1971); AsI % = (å L / å L+S) x 100 (according to Arano and Saito 1980); SD, standard deviation.

Chromosome pair s (µm) l (µm) c (µm) (l/s) i Chromosome type
1 1.64 (0.15) SD 1.79 (0.12) 3.43 1.09 47.92 m
2 1.54 (0.18) 1.72 (0.12) 3.27 1.12 47.27 m
3 1.46 (0.20) 1.77 (0.11) 3.23 1.21 45.30 m
4 1.48 (0.19) 1.65 (0.14) 3.13 1.11 47.29 m
5 1.42 (0.17) 1.64 (0.13) 3.06 1.16 46.36 m
6 1.42 (0.17) 1.62 (0.12) 3.04 1.14 46.76 m
7 1.34 (0.17) 1.60 (0.13) 2.94 1.19 45.59 m
8 1.34 (0.18) 1.50 (0.12) 2.84 1.12 47.17 m
9 1.21 (0.17) 1.54 (0.14) 2.75 1.26 44.16 m
10 1.17 (0.16) 1.46 (0.13) 2.63 1.24 44.56 m
11 1.13 (0.18) 1.38 (0.09) 2.51 1.23 44.84 m
12 1.13 (0.11) 1.31 (0.09) 2.44 1.17 46.15 m
13 1.05 (0.12) 1.27 (0.10) 2.32 1.20 45.38 m
14 1.04 (0.11) 1.26 (0.09) 2.29 1.22 45.14 m
15 1.01 (0.13) 1.15 (0.13) 2.16 1.14 46.69 m
16 0.98 (0.13) 1.09 (0.12) 2.07 1.11 47.41 m
17 0.91 (0.15) 1.05 (0.11) 1.96 1.16 46.36 m
18 0.84 (0.10) 0.98 (0.12) 1.82 1.17 46.08 m
Discussion Heterochromatin pattern

The GC-rich DNA regions detected in hexaploids are distributed in telomeric regions of chromosomes and corresponded to the 18S rDNA loci. This colocalization of GC rich heterochromatin and rDNA has already been reported for numerous plants and animal species (Siljak-Yakovlev et al. 2003 and references therein, Hamon et al. 2009, Muratović et al. 2010, Bogunic et al. 2011). After prolongation of staining time with CMA3, signals found in the rare cases were not visible in all 18S rDNA loci. The lack of CMA signals in 18S rDNA sites can be explained by low number of GC pair repetitions (at least four according Godelle et al. 1993). The same phenomenon was observed in Hydrangea aspera David Don, 1799-1841 (Mortreau et al. 2010). The centromeric DAPI+ bands were observed only in tetraploid population. DAPI used as a counterstaining in FISH experiments after denaturation/renaturation of DNA reveals heterochromatin as demonstrated by several authors (Siljak-Yakovlev et al. 2002, Muratović et al. 2005, Bogunic et al. 2006 and 2011, Barros e Silva and Guerra 2010, Muratović et al. 2010).

rDNA gene organization

It was obvious to notice that the number of 5S and 18S rDNA sites corresponded to the ploidy level. In tetraploid individuals it was four, in pentaploids five and in hexaploids six signals. Similar phenomenon occurred in polyploids of some other genera, such as Saccharum Linnaeus, 1753 (D’Hont et al. 1998), Passiflora Linnaeus, 1753 (De Melo and Guerra 2003) and Ipomoea Linnaeus, 1753 (Srisuwan et al. 2006).

Tetraploid individuals of Cenchrus ciliaris show four signals for both 5S and 18S, the same result obtained by Akiyama et al. (2005). Pentaploid and hexaploid cytotypes of Cenchrus ciliaris have not been previously analysed for their rDNA patterns. Our results show that polyploidy is associated with increase in number of rDNA loci. Similar result was observed by Akiyama et al. (2008) on Panicum maximum Jacq,  1786. They found that the numbers of 5S rDNA loci in the diploids and tetraploids were two and four, respectively. Also, the FISH data obtained by Srisuwan et al. (2006) on Ipomoea species indicated that the number of 5S rDNA loci corresponded and increased linearly with the ploidy level while the number of 18S rDNA loci decrease in polyploid Ipomoea batatas. Adachi et al. (1997) found that in polyploid series of Brochyscome lineariloba (De Candolle) Druce 1917, the number of 5S rDNA sites increased linearly with the ploidy level, but 18S–26S rDNA was restricted to a single major locus. A proportional gain of ribosomal loci from hexaploid level to octoploid has also been observed in Artemisia mendozana De Candolle, 1837 (Pellicer et al. 2010). Loss or addition of rDNA loci during the evolution of a polyploid plant species has been documented in Triticum Linnaeus, 1753 (Mukai et al. 1991, Kim et al. 1993), Gossypium Linnaeus, 1753 (Crane et al. 1993, Hanson et al. 1996), and Avena Linnaeus, 1753 (Jellen et al. 1988).

A comparison of hybridization patterns between the two probes revealed identical results within each ploidy level of Cenchrus ciliaris. Thus the number of 18S and 5S rDNA loci in different individuals of each ploidy level was constant. This can be explained by the genome stability occurring in the three ploidy levels. This highly conserved nature of both 5S and 18S rDNA loci during polyploid evolution within Cenchrus ciliaris is not in accordance with observations made in hexaploid of Ipomea batata, indeed within this cytotype some varieties presented 18 signals of 18S and other 12 signals (Srisuwan et al. 2006). Therefore, during polyploid evolution, plant species differ in the degree of the stability of rDNA sites, and different species show different trends in rDNA site-number change. Despite a conserved organization of rDNA sites within each ploidy level, recent molecular investigation of the three ploidy levels of Cenchrus ciliaris in Tunisia (Kharrat-Souissi et al. 2011) revealed the existence of completely distinct genotypes for pentaploids, suggesting that this cytotype may has two different origins.

In analyzed individuals of Cenchrus ciliaris all 5S rDNA loci were localized on paracentromeric region of chromosome pairs 8 and 10, while 18S loci were situated on telomeric region of short chromosome arm of pairs 11 and 14. Akiyama et al. (2005) detected the same position for 18S rDNA signals, but they located the 5S signals on the long arm adjacent to the centromere. In our tetraploid population the 5S rDNA sites were observed on the short chromosome arms (Fig. 2F). Chromosome measurements and accurate location of centromere position could explain this difference in the position of 5S signals.

The size and the intensity of both hybridization signals slightly varied among investigated individuals. This can be explained by different copy number of repeats among rDNA sites which has been also detected in several other plant species (Weiss-Schneeweiss et al. 2003, Srisuwan et al. 2006).

The distribution of investigated populations of Cenchrus ciliaris in Tunisia follows a north-south bioclimatic gradient, where ploidy level and genome size are increasing with aridity (Kharrat-Souissi et al. in press). Namely, tetraploids are present in the most humid areas, pentaploids exist in the center of the country, whilst hexaploids occur from the semi-arid to the Saharan limits, suggesting that this cytotype is better adapted to different environmental conditions (Fig. 1). Hamon et al. (2009) reported that the number of 18S and 5S rDNA appears to be correlated with the genome size and the geographic distribution of the Coffea Linnaeus, 1753 species.

In the present study the number of signals of 5S and 18S rDNA loci in pentaploids was intermediate between tetraploids and hexaploids. This result seems to indicate that pentaploid individuals might have derived from hybridization events between tetraploids and hexaploids. Although the apomictic mode of reproduction known as apospory displayed by most Cenchrus ciliaris genotypes, rare sexual individuals have been identified (Fisher et al. 1954, Sherwood et al. 1980). Using AFLP markers for the Tunisian Cenchrus ciliaris, differences between individuals descending from the same plant mother were observed. This unexpected level of variability for an apomictic species suggests that the sexual mode of reproduction is not rare in native populations of Cenchrus ciliaris. The mode of reproduction of the three ploidy levels of Cenchrus ciliaris in Tunisia was investigated using Flow Cytometric Seed Screening (FCSS; Kharrat-Souissi et al. in press). Observations using FCSS (high 2C embryo peak with a smaller 3C endosperm peak) do not clarify the reproductive mode of the investigated individuals, because the endosperm cells of both the aposporous and sexual plants yield 3C values (Kharrat-Souissi et al. in press). In the case of the aposporous Cenchrus ciliaris, forming an embryo sac of Panicum type, which produces four unreduced nuclei per ovule, the traditional cytological technique of dissecting immature ovaries would appear more appropriate (Visser et al. 2000).

Our data of the FISH experiments show proportional increase of ribosomal loci number during polyploidization processes. However ploidy level increases with aridity (from tetraploid to hexaploid) and give a cytogenetic basis to the considerable differentiation noted between north (humid area) and south (arid area) Tunisian populations of Cenchrus ciliaris.

Acknowledgments

The authors are grateful to O. Robin for assistance in cytogenetic and to A. Vucicevic for linguistic help. They are also indebted to the Ministry of Education and Science of Tunisia, CNRS (Centre National de la Recherche Scientifique) and Comité Mixte de Coopération Universitaire France-Tunisie (CMCU,  project n° 09G 0901) for their financial support.

References
Adachi J, Watnabe K, Fukui K, Ohmido N, Kosuge K (1997) Chromosomal location and reorganization of the 45S and 5S rDNA in the Brachyscome linearriloba complex (Asteraceae). Journal Plant Research 110: 371-377. doi:  10.1007/BF02524936
Akiyama Y, Hanna WW, Ozias-Akins P (2005) High-resolution physical mapping reveals that the apospory-specific genomic region (ASGR) in Cenchrus ciliaris is located on a heterochromatic and hemizygous region of a single chromosome. Theoretical and Applied Genetics 111: 1042-1051. doi: 10.1007/s00122-005-0020-5
Akiyama Y, Yamada-Akiyama H, Yamanouchi H, Takahara M, Ebina M, Takamizo T, Sugita SI, Nakagawa H (2008) Estimation of genome size and physical mapping of ribosomal DNA in diploid and tetraploid guineagrass (Panicum maximum Jacq.). Grassland Science 54: 89-97. doi: 10.1111/j.1744-697X.2008.00110.x
Arano H, Saito H (1980) Cytological studies in family Umbelliferae 5. Karyotypes of seven species in subtribe Seselinae. La Kromosomo, 2: 471-480.
Barros e Silva AE, Guerra M (2010) The meaning of DAPI bands observed after C -banding and FISH procedures. Biotechnic and Histochemistry 85: 115-125. doi: 10.3109/10520290903149596
Bogunic F, Muratovic E, Siljak-Yakovlev S (2006) Chromosomal differentiation between Pinus heldreeichii and Pinus nigra. Annals of Forest Science 63: 267-274. doi: 10.1051/forest:2006005
Bogunic F, Siljak-Yakovlev S, Muratovic E, Pustahija F, Medjedovic S (2011) Molecular cytogenetics and flow cytometry reveal conserved genome organization in Pinus mugo and P. uncinata. Annals of Forest Science 68: 179-187. doi: 10.1007/s13595-011-0019-9
Burson BL, Hussey MA, Actkinson JM, Shafer GS (2002) Effect of pollination time on the frequency of 2n + n fertilization in apomictic Buffelgrass. Crop Science 42: 1075–1080. doi : 10.2135/cropsci2002.1075
Cabral JS, Felix LP, Guerra M (2006) Heterochromatin diversity and its co-localization with 5S and 45S rDNA sites in chromosomes of four Maxillaria species (Orchidaceae). Genetics and Molecular Biology 29: 659-664. doi: 10.1590/S1415-47572006000400015
Chaieb M, Henchi B, Boukhris M (1996) Impact of clipping on root systems of 3 grass species in Tunisia. Journal of Range Management 49: 336-339. doi: 10.2307/4002593
Crane CF, Price HJ, Stelly DM, Czeschin DGJ, Mcknight TD (1993) Identification of homeologous chromosome pairs by in situ DNA hybridization to ribosomal RNA loci in meiotic chromosomes of cotton (Gossypium hirsutum). Genome 36: 1015-1022. doi: 10.1139/g93-135
D’Hont A, Ison D, Alix K, Roux C, Glaszmann JC (1998) Determination of basic chromosome numbers in the genus Saccharum by physical mapping of ribosomal RNA genes. Genome 41: 221–225. http://www.nrcresearchpress.com/doi/pdf/10.1139/g98-023
De Jong H (2003) Visualizing DNA domains and sequences by microscopy: a fifty-year history of molecular cytogenetics. Genome 46: 943-946. doi: 10.1139/G03-107
De Melo NF, Guerra M (2003) Variability of the 5S and 45S rDNA sites in Passiflora L. species with distinct base chromosome number. Annals of Botany 92: 309-316. doi: 10.1093/aob/mcg138
Fisher WD, Bashaw EC, Holt EC (1954) Evidence for apomixis in Pennisetum ciliare and Cenchrus setigerus. Agronomy Journal 46: 401-404. doi: 10.2134/agronj1954.00021962004600090002x
Floret C, Le Floc’h E, Romane F, Pontanier R (1981) Dynamique des systèmes écologiques de la zone aride. Application à l’aménagement sur les bases écologiques d’une zone de la Tunisie présaharienne. Acta Oecologica 2: 195–214. http://www.documentation.ird.fr/hor/fdi:28728
Fregonezi JN, Torezan JMD, Vanzela ALL  (2004) A karyotypic study of three southern Brazilian Asteraceae species using fluorescence in situ hybridization with a 45S rDNA probe and C-CMA3 banding.  Genetics and Molecular Biology  27: 223-227. doi: 10.1590/S1415-47572004000200016
Geber G, Schweizer D (1987) Cytochemical hetero- chromatin differentiation in Sinapis alba (Cruciferae) using a simple air-drying technique for producing chro- mosome spreads. Plant Systematic and Evolution 158: 97-106. doi: 10.1007/BF00936336
Godelle B, Cartier D, Marie D, Brown CS, Siljak-Yakovlev S (1993) Heterochromatin study demonstrating the non-linearity of fluorometry useful for calculating genomic base composition. Cytometry 14: 618-626. doi: 10.1002/cyto.990140606
Hall TJ (2001) History and development of buffelgrass pasture lands in Queensland. Proceedings of Buffelgarss Workshop. Theodore Qld, February 21–23, 2000. Departement of Primary Industries, Brisbane, Australia, 2–12.
Hamon P, Siljiak-Yakovlev S, Srisuwan S, Robin O, Poncet V, Hamon S, De Kochko A (2009) Physical mapping of rDNA and heterochromatin in chromosomes of 16 Coffea species: A revised view of species differenciation. Chromosome Research 17: 291-304. doi: 10.1007/s10577-009-9033-2
Hanson RE, Islam-Faridi MN, Percival EA, Crane CF, Ji Y, McKnight TD, Stelly DM, Price HJ (1996) Distribution of 5S and 18S–28S rDNA loci in a tetraploid cotton (Gossypium hirsutum L.) and its putative diploid ancestors. Chromosoma 105: 55-61. doi: 10.1007/BF02510039
Heslop-Harrison JS (2000) Comparative genome organization in plants: from sequence and markers to chromatin and chromosomes. Plant Cell 12: 617-635. doi: 10.1105/tpc.12.5.617
Heslop-Harrison JS, Schwarzacher T, Anamthawat-Jónsson K, Leitch AR, Shi M, Leitch IJ (1991) In situ hybridization with automated chromosome denaturation. Technique 3: 109-115.
Jauffret S, Lavorel S (2003) Are plant functional types relevant to describe degradation in arid, southern Tunisian steppes? Journal of Vegetation Science 14: 399–408. doi: 10.1111/j.1654-1103.2003.tb02165.x
Jellen EN, Phillips RL, Rines HW (1988) Molecular genetic characterization of oat ribosomal DNAs. In: Agronomy Abstracts. CA: American Society of Agronomy, Anaheim, 169 pp.
Jiang J, Gill BS (2006) Current status and the future of fluorescence in situ hybridization (FISH) in plant genome research. Genome 49: 1057-1068. doi: 10.1139/G06-076
Kharrat-Souissi A, Siljak-Yakovlev S, Brown S, Chaieb M (in press) Cytogeography of Cenchrus ciliaris (Poaceae) in Tunisia. Folia Geobotanica.
Kharrat-Souissi A, Baumel A, Torre F, Juin M, Siljak-Yakovlev S, Roig A, Chaieb M (2011) New insights into the polyploid complex Cenchrus ciliaris L. (Poaceae) show its capacity for gene flow and recombination processes despite its apomictic nature. Australian Journal of Botany 59: 543–553.  doi: 10.1071/BT10312
Kim NS, Kuspira J, Armstrong K, Bhambhani R (1993) Genetic and cytogenetic analyses of the A genome of Triticum monococcum. VII. Localization of rDNAs and characterization of the 5S rRNA genes. Genome 36: 77-86. doi: 10.1139/g93-011
Le Houérou HN, Hoste CH (1977) Rangeland production and annual rainfall relationships in the Mediterranean basin and in the African Sahelo-Sudanian zone. Journal of Range Management 30: 181–189. doi: 10.2307/3897463
Le Houérou HN, Ionesco T (1973) L’appétabilité des espèces végétales de la Tunisie Steppique. Division Production et Protection des Plantes, FAO, Rome, 68 pp.
Levan A, Fredga K, Sandberg AA (1964) Nomenclature for centromere position in chromosomes. Hereditas 52: 201-220. doi: 10.1111/j.1601-5223.1964.tb01953.x
Mortreau E, Siljak-Yakovlev S, Cerbah M, Brown SC, Bertrand H, Lambert C (2010) Cytogenetic characterization of Hydrangea involucrata Sieb. and H. aspera D. Don complex (Hydrangeaceae): genetic, evolutional, and taxonomic implications. Tree Genetics and Genomes 6: 137-148. doi: 10.1007/s11295-009-0235-8
Mseddi K, Mnif L, Chaieb M, Neffati M, Roux M (2004) Aboveground phytomass productivity and morphologic variability of Tunisian accessions of Cenchrus ciliaris. African Journal of Range and Forage Science 19: 13-20. doi: 10.2989/10220110409485833
Mukai Y, Endo TR, Gill BS (1991) Physical mapping of the 18S.26S rRNA multigene family in common wheat: identification of a new locus. Chromosoma 100: 71-78. doi: 10.1007/BF00418239
Muratović E, Bogunic F, Soljan D, Siljak-Yakovlev S (2005) Does Lilium bosniacum merit species rank? A classical and molecular cytogenetic approaches. Plant Systematic Evolution 252: 97-109. doi: 10.1007/s00606-004-0282-4
Muratović E, Robin O, Bogunic F, Soljan D, Siljak-Yakovlev S (2010) Speciation of European lilies from Liriotypus section based on karyotype evolution. Taxon 59: 165-175. http://www.ingentaconnect.com/content/iapt/tax/2010/00000059/00000001/art00016
Ozias-Akins P, Akiyama Y, Hanna WW (2003) Molecular characterization of the genomic region linked with apomixis in Pennisetum/Cenchrus. Functional and Integrative Genomics 3: 94-104. doi: 10.1007/s10142-003-0084-8
Pellicer J, Garnatje T, Molero J, Pustahija F, Siljak-Yakovlev S, Vallès J (2010) Origin and evolution of the South American endemic Artemisia species (Asteraceae): evidence from molecular phylogeny, ribosomal DNA and genome size data. Australian Journal of Botany 58: 605-616. doi: 10.1071/BT10047
Schweizer D (1976) Reverse fluorescent chromosome banding with chromomycin and DAPI. Chromosoma  58: 307-324. doi: 10.1007/BF00292840
Sherwood RT, Young BA, Bashaw EC (1980) Facultative apomixis in buffelgrass. Crop Science 20: 375-379. doi: 10.2135/cropsci1980.0011183X002000030022x
Siljak-Yakovlev S, Cerbah M, Coulaud J, Stoian V, Brown SC, Jelenic S, Papes D (2002) Nuclear DNA content, base composition, heterochromatin and rDNA in Picea omorika and Picea abies. Theoretical and Applied Genetics 104: 505-512. doi: 10.1007/s001220100755
Siljak-Yakovlev S, Paccenini S, Muratovic E, Zoldos V, Robin O, Valles J (2003) Chromosomal differentiation and genome size in three European mountain Lilium species. Plant Systematic and Evolution 263: 165-173. doi: 10.1007/s00606-002-0240-y
Srisuwan S, Sihachakr D, Siljak-Yakovlev S (2006) The origin and evolution of sweet potato (Ipomoea batatas Lam.) and its wild relatives through the cytogenetic approaches. Plant Science 171: 424-433. doi: 10.1016/j.plantsci.2006.05.007
Stebbins GL (1971) Chromosomal evolution in higher plants. Addison-Wesley, Reading, Massachusetts, USA, 216 pp.
Stieber MT, Wipff JK (2003) Cenchrus L. In: Barkworth ME et al. (Eds) Flora of North America north of Mexico. Oxford University Press, New York, Oxford, 529–535.
Visser NC, Spies JJ, Venter HJT (2000) Apomictic embryo sac development in Cenchrus ciliaris (Panicoideae). Bothalia 30: 103-110.
Watson L, Dallwitz MJ (1992) The Grass Genera of the World. CAB International, Wallingford, 1038 pp.
Weiss-Schneeweiss H, Stuessy TF, Siljak-Yakovlev S, Baeza CM, Parker J (2003) Karyotype evolution in South American species of Hypochaeris (Asteraceae, Lactuceae). Plant Systematic and Evolution 241: 171-184. doi: 10.1007/s00606-003-0026-x
Wendel JF (2000) Genome evolution in polyploids. Plant Molecular and Biology 42: 225-249. doi: 10.1023/A:1006392424384