


(C) 2012 Lorenzo Peruzzi. This is an open access article distributed under the terms of the Creative Commons Attribution License 3.0 (CC-BY), which permits unrestricted use, distribution, and reproduction in any medium, provided the original author and source are credited.
For reference, use of the paginated PDF or printed version of this article is recommended.
We compared chromosome number (CN) variation among vascular floras of three different countries with increasing latitude in the Boreal hemisphere: Italy, Slovakia, Poland. Aim of the study was to verify whether the patterns of CN variation parallel the differences in latitudinal ranges. The three datasets comprised 3426 (Italy), 3493 (Slovakia) and 1870 (Poland) distinct cytotypes. Standard statistics (ANOVA, Kruskal–Wallis tests) evidenced significant differences among the three countries, mean CN increasing together with latitude. On the contrary, an inverse relation (r = -1) was evidenced among the frequency of odd CNs and latitude. Our results show that the hypothesis of a polyploid increase proportional with distance from the Equator seems to be confirmed, when territories from the same hemisphere are compared.
Biogeography, chromosome number, cytogeography, cytotaxonomy, Europe, polyploidy
Chromosome number is the most basic feature concerning the genome of a species, and it is also the easiest to obtain, technically. For this reason, since 1882 (
As already pointed out by
A natural prosecution of the above mentioned studies, concerning geographical variation of mean chromosome number, was to extend the sample coverage, by selecting further countries (from the same hemisphere) to test the hypothesis that mean chromosome number in vascular plants tends to increase in parallel with latitude / cooler bioclimate. Accordingly, the aim of this study is to quantitatively evaluate chromosome number variation of vascular floras among three countries with increasing latitude and decreasing altitudinal range (Table 1): Italy, Slovakia and Poland.
Range of latitudes (in degrees and in km) and altitudes for the considered countries.
| Degrees | Km | Altitude | |
|---|---|---|---|
| Italy | 35°29' to 47°05'N | 1500 | 0–4810 m a.s.l. |
| Slovakia | 47°40' to 49°35'N | 200 | 94–2655 m a.s.l. |
| Poland | 48°59' to 54°49'N | 650 | -2–2499 m a.s.l. |
Chromosome numbers from the considered countries were taken from available online databases. Chrobase.it (
Similarly to
A total of 146 different CNs were found, ranging from 2n = 6 (in all datasets) to 2n = 304 (in the Slovak dataset only). The families included in the datasets were 107 for Italy, 123 for Slovakia and 114 for Poland. Of them, 82 were shared by all datasets. Most of the data (39–40% of each dataset) were concentrated in five families: Asteraceae, Brassicaceae, Fabaceae, Poaceae, Ranunculaceae (Table 2). CNs are apparently distributed in different proportions in the three geographical areas (Table 3; Figure 1). The most frequent (modal) CN in Italy is 2n = 18; in Slovakia it is 2n = 16 and in Poland 2n = 28. Despite this, mean CN is increasing from Italy, through Slovakia, to Poland (Table 1). This difference is supported by ANOVA (F = 22.412, p < 0.000), despite the absence of a significant distinction between Slovakia and Poland. On the contrary, the frequency of odd CNs (fOCN) tends to decrease from Italy to Poland (Spearman correlation between mean CN and fOCN: r = - 1.0, p < 0.01), while the frequency of B-chromosomes is nearly 8-fold more frequent in Italy than in the other two countries. Indeed, B-chromosomes occur in 246 registered cytotypes (148 taxa) of the Italian vascular flora, in 65 cytotypes (27 taxa) of the Slovak flora and in 39 cytotypes (19 taxa) of Poland flora. Among the taxa showing B-chromosomes, their mean number is 2.03 ± 1.75 in Italy, 2.80 ± 1.99 in Slovakia and 1.95 ± 1.07 in Poland. Since the data on B-chromosome numbers did not follow a normal distribution, we performed the non-parametric Kruskal–Wallis test, which failed, however, to find significant differences between the number of B-chromosomes among the three geographical areas.
Most represented families in the three datasets (> 100 registered cytotypes in at least one country).
| Italy | Slovakia | Poland | ||||
|---|---|---|---|---|---|---|
| cytotypes | % | cytotypes | % | cytotypes | % | |
| Amaryllidaceae | 118 | 3.4 | 58 | 1.7 | 24 | 1.3 |
| Asteraceae | 579 | 16.9 | 573 | 16.4 | 275 | 14.7 |
| Asparagaceae | 135 | 3.9 | 53 | 1.5 | 21 | 1.1 |
| Brassicaceae | 193 | 5.6 | 238 | 6.8 | 80 | 4.3 |
| Caryophyllaceae | 133 | 3.9 | 145 | 4.2 | 56 | 3.0 |
| Cyperaceae | 56 | 1.6 | 110 | 3.1 | 36 | 1.9 |
| Fabaceae | 306 | 8.9 | 180 | 5.2 | 81 | 4.3 |
| Juncaceae | 9 | 0.3 | 103 | 2.9 | 18 | 1.0 |
| Lamiaceae | 111 | 3.2 | 127 | 3.6 | 62 | 3.3 |
| Orchidaceae | 158 | 4.6 | 62 | 1.8 | 30 | 1.6 |
| Plumbaginaceae | 128 | 3.7 | 4 | 0.1 | 1 | 0.1 |
| Poaceae | 166 | 4.8 | 251 | 7.2 | 209 | 11.2 |
| Ranunculaceae | 144 | 4.2 | 152 | 4.4 | 91 | 4.9 |
| Rosaceae | 27 | 0.8 | 187 | 5.4 | 118 | 6.3 |
| other families | 1163 | 33.9 | 1250 | 35.8 | 768 | 41.1 |
Chromosome number parameters calculated for each country dataset.
| N°cytotypes | CN | ± SD | median | mode | CVCN | fB | fOCN | |
|---|---|---|---|---|---|---|---|---|
| Italy | 3426 | 30.560 | 22.060 | 24 | 18 | 72.186 | 0.071 | 0.087 |
| Slovakia | 3493 | 33.818 | 12.728 | 28 | 16 | 37.637 | 0.019 | 0.070 |
| Poland | 1870 | 33.820 | 23.386 | 28 | 28 | 69.149 | 0.021 | 0.044 |
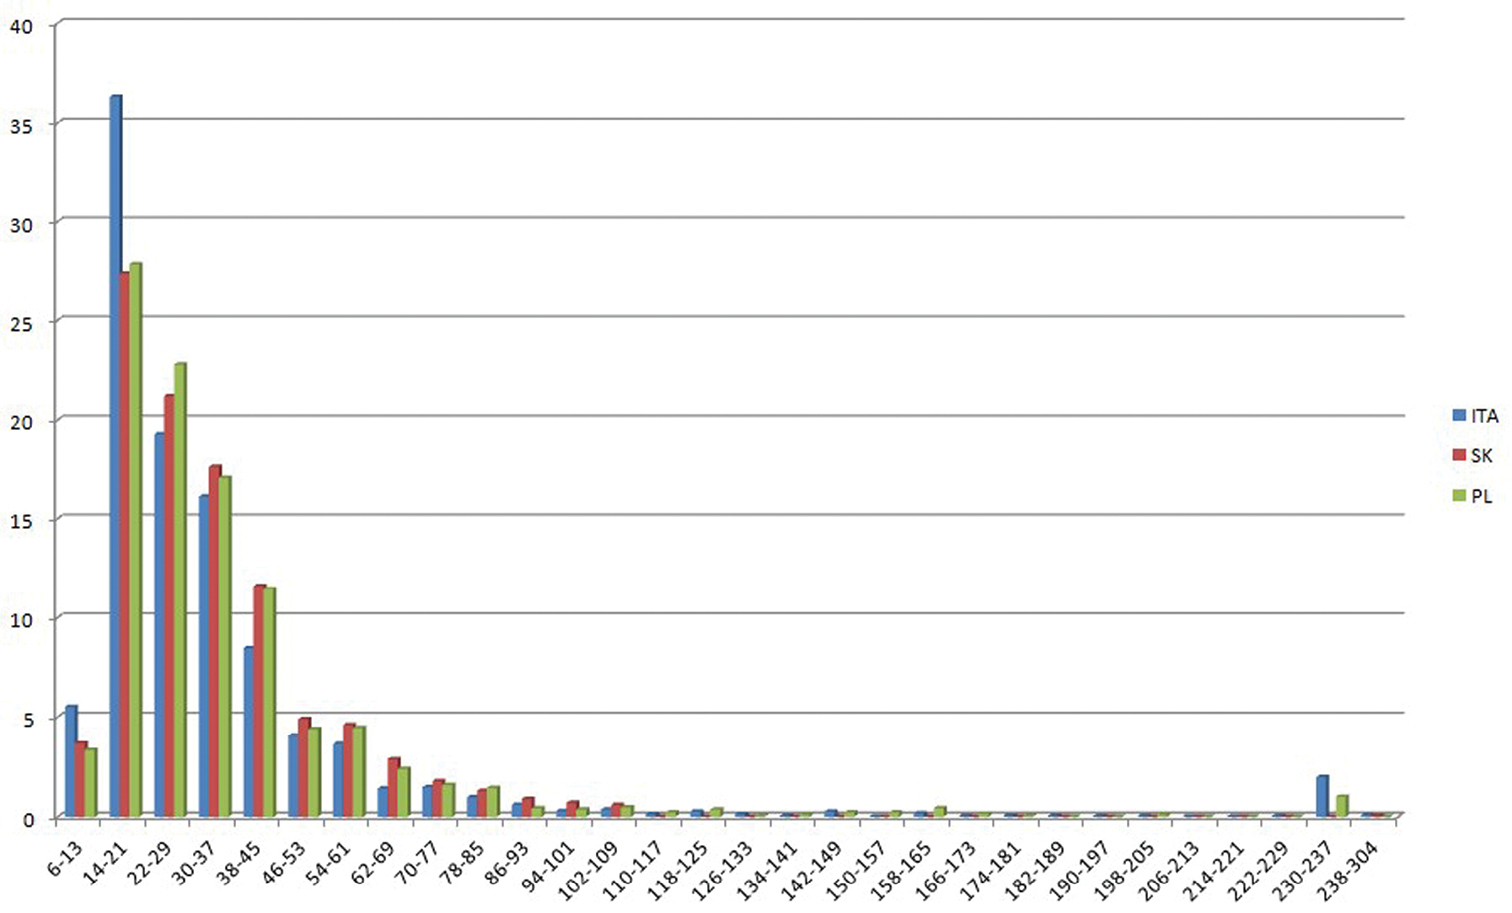
Histograms showing the percentage frequencies (y-axis) of 2n chromosome numbers, grouped in classes (x-axis) known for the Italian (ITA), Slovak (SK) and Polish (PL) vascular flora.
According to our results, it was possible to confirm that, in Boreal hemisphere, mean CN in vascular plants tends to increase with increasing latitude, as already suggested by
The idea that polyploidy tends to increase with latitude is not new (
The use of mean CN as a proxy of polyploidy has the advantage to be easier to assess and more objective, albeit less precise. Indeed, CNs are unquestionable, while basic CNs are often subjective (see for instance the recent debate in
A further interesting point to address with further research is the seemingly different pattern of CN variation among the two hemispheres:
Contrary to what was observed for Italy (
We are indebted to Prof. Karol Marhold (Bratislava) for having kindly provided an electronic version of the database for chromosome numbers of Slovakian flora.